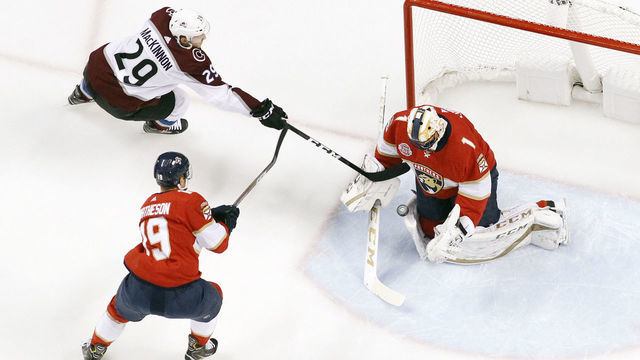
Many predicted the Florida Panthers would challenge for an Eastern Conference wild-card spot this season. The team woke up Monday morning nine points out of the playoffs.
Not ideal.
Several factors have contributed to Florida's position - including a cringe-worthy .887 save percentage - but there's an undeniable trend: Panthers games almost always involve a comeback, and they've usually been the victim.
The 17-16-7 Panthers have won only four of 13 games they've led after the first period. Weirdly enough, however, Florida has won a bunch when trailing after the first period, picking up six wins in 15 tries.
"It's definitely something we've talked about in our locker room," defenseman Mike Matheson told theScore recently. "We've been on the right end of that and been on the wrong end of it."
And comebacks are not exclusive to the Panthers and their combatants. Far from it.
Rallying to victory has become remarkably common across the NHL, with the opening half of 2018-19 - Oct. 3 through this past Friday - producing a record number of comeback wins (285) through the first 635 games of a season. Amazingly, 13.2 percent of all games in the first half featured a team overcoming a multi-goal deficit to win. That's 84 multi-goal turnarounds in a three-month span.
"It's good to hear that it's going on everywhere in the league," Matheson continued, smiling a bit. "We were starting to think it was just us."
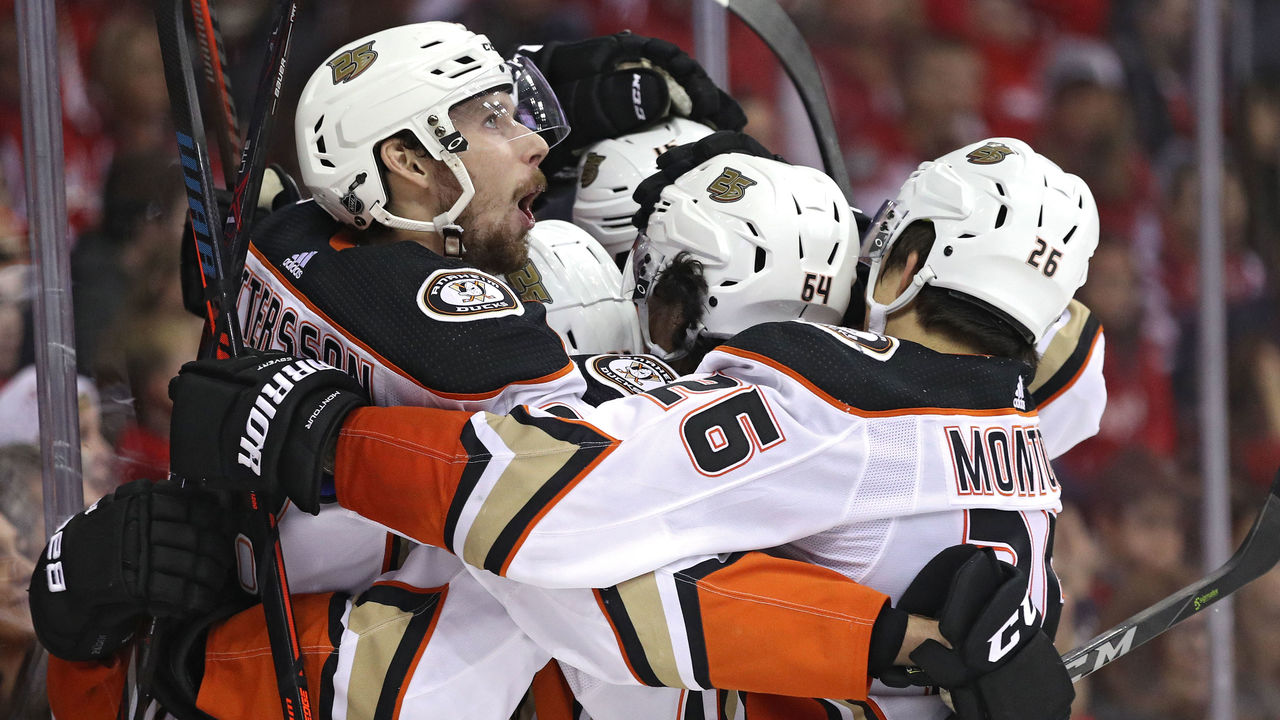
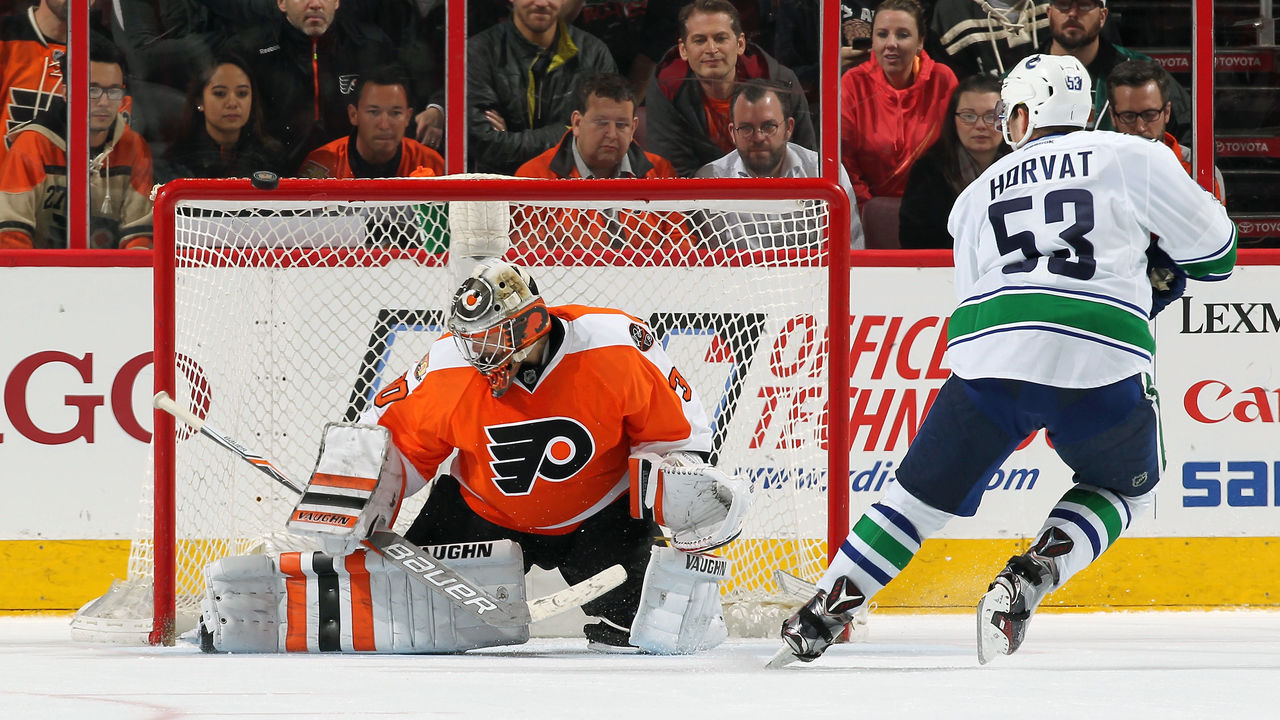
Some of this season's memorable comebacks include the Anaheim Ducks erasing a four-goal deficit en route to a 6-5 win over the Washington Capitals in early December; the Ottawa Senators battling back from a three-goal margin to snag a 4-3 win from the Philadelphia Flyers in late November; and, just last week, the Minnesota Wild defeating the Toronto Maple Leafs 4-3 despite falling behind 2-0 early in the first period.
"I feel like you're never really out of it, and that's the mentality across the league," Wild forward Marcus Foligno said following his club’s victory.
So, why has '18-19 become synonymous with comebacks? For starters, there's no denying the commitment to offense from NHL managers, coaches, and players. Every passing year, it becomes more evident that speed and skill win games, playoff rounds, and championships.
Logically, the more goals, the more lead changes. And there's been an uptick in scoring over the past few seasons, even though shots per game have finally stabilized:
| YEAR | GOALS/GAME | SHOTS/GAME | SV% |
|---|---|---|---|
| 2018-19 | 6.1 | 62.6 | .909 |
| 2017-18 | 5.9 | 63.6 | .912 |
| 2016-17 | 5.5 | 60.2 | .913 |
| 2015-16 | 5.4 | 59.2 | .915 |
Panthers forward Troy Brouwer, now on his fifth team in an 800-game career, became a full-time NHLer four years after the 2004-05 lockout. By then, the league had bid farewell to the dead-puck era, yet a defense-first mindset remained. More than a decade later, it's all but gone.
"The style of game 12 years ago is different than it is now," he said. "It was more of a trap game. You wouldn't give opponents a whole lot. You don't play that as much anymore. The speed and skill have taken over and the game is more open now, in my opinion, versus when I first came into the league."
By and large, dumping and chasing has been supplanted by stretch passes and other aggressive, risky ways to push the puck north. The neutral zone is an area of focus for inquisitive coaches, and analytical studies underline its link to winning hockey.
Fighting fire with fire, no matter what the scoreboard reads, seems to be a popular philosophy. Up 3-0, tied 2-2, or down 4-1? Don't take your foot off the gas.
It's not a perfect approach, and in the era of parity, it can produce lead changes, but Brouwer explains it's better than the alternative. "You have to stay in attack mode now," he said. "If you let off, you're pretty much just giving the puck back to the other team."
Don't forget that recent changes to rules and regulations - and alterations in their enforcement - were approved for the purpose of increasing scoring. Most notably, goaltender equipment was trimmed to give shooters an advantage, and the crackdown on slashing has forced blue-liners to defend more politely.
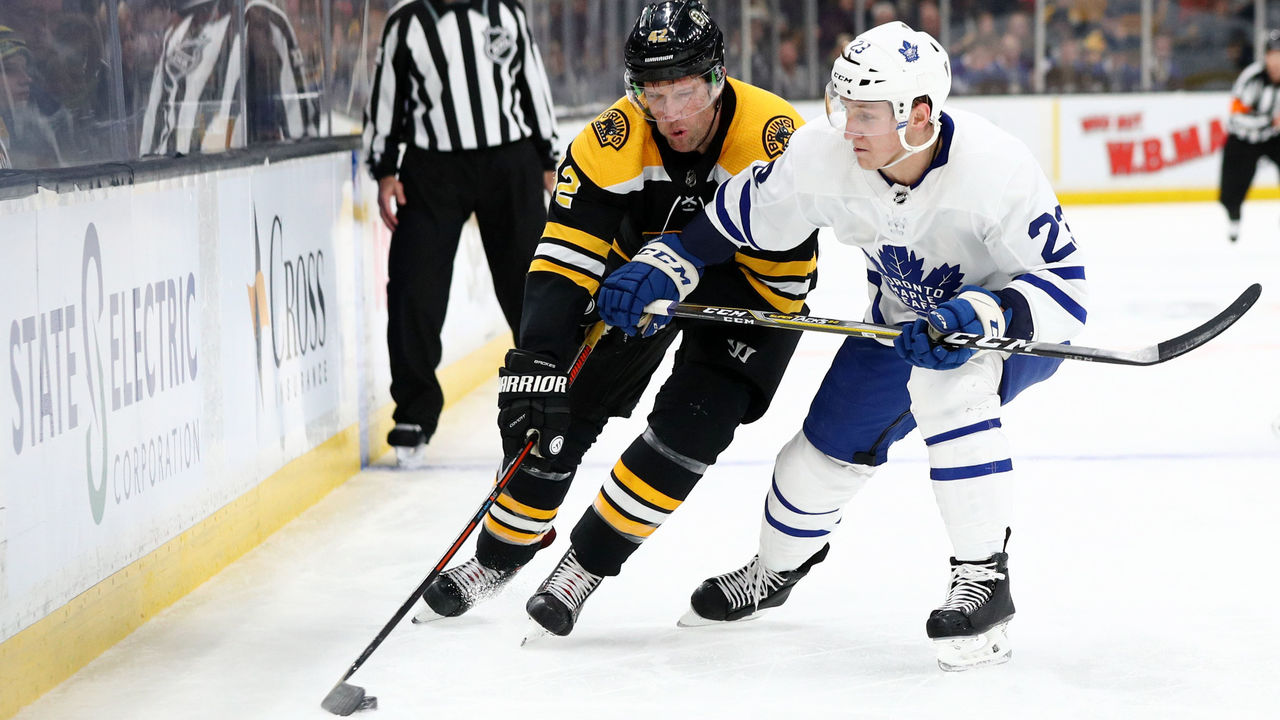
"I think anytime you have your stick horizontal on the ice, you're going to get a penalty," Maple Leafs defenseman Travis Dermott said. "You definitely have to have your feet going. And with the speed nowadays, you definitely have to be fast to keep up with forwards."
Matheson added, "If somebody with the puck gets body position on you, there's pretty much nothing you can do to get the puck off them without taking a penalty."
And if your team takes a penalty, good luck. Power plays are dangerously effective in 2019. The Tampa Bay Lightning boast a ridiculous 30 percent success rate, and the league average is hovering around 20 percent for a second straight season. Once considered risque, having four forwards on one top-heavy unit has become common practice.
"Instead of having two balanced units, everyone is just loading up one unit and playing them a minute-and-a-half, two minutes on the power play," Matheson noted. "And it works. To have your five best players on the ice, they're going to make plays and are going to be able to score goals."
The Panthers have experimented with a five-forward power-play unit, emphasizing the shift toward an NHL that prioritizes offense.
"It's a scoring league, 100 percent," Matheson said.
A comeback league, too, apparently.
__________
Pressing pause on the season at the halfway point can also be beneficial at the team level - especially when trying to forecast or manage expectations for the second half.
One way to do this is to dive into some underlying numbers - stats on who's endured the most/fewest injuries, experienced the worst/best puck luck, and faced the most difficult/easiest competition.
On the first front, thanks to Nathan Currier's fine work at ManGamesLost.com, it's clear some teams have been ravaged by injuries while others have enjoyed relatively good health (MGL = man games lost to injury in first half):
| RANK | TEAM | MGL |
|---|---|---|
| 1 | ANA | 212 |
| 2 | PHI | 210 |
| 3 | ARI | 209 |
| 4 | DAL | 198 |
| 5 | OTT | 184 |
| 5 | LAK | 184 |
| RANK | TEAM | MGL |
|---|---|---|
| 27 | WPG | 47 |
| 28 | TOR | 33 |
| 29 | MIN | 27 |
| 30 | CBJ | 24 |
| 31 | SJS | 21 |
The Dallas Stars are an interesting case, particularly in light of CEO Jim Lites blasting marquee forwards Tyler Seguin and Jamie Benn over the holidays.
The Stars have been challenged by injuries, especially on the back end, with Stephen Johns sidelined all season and No. 1 defenseman John Klingberg missing 18 games. Somehow, Dallas is one of four teams that missed the playoffs last year but is holding down a playoff spot at the midway point of this season.
Ranking 16th among 31 teams, the Stars can't otherwise claim they were particularly lucky or unlucky in the first half, based on the advanced stat PDO (save percentage plus shooting percentage):
| RANK | TEAM | PDO |
|---|---|---|
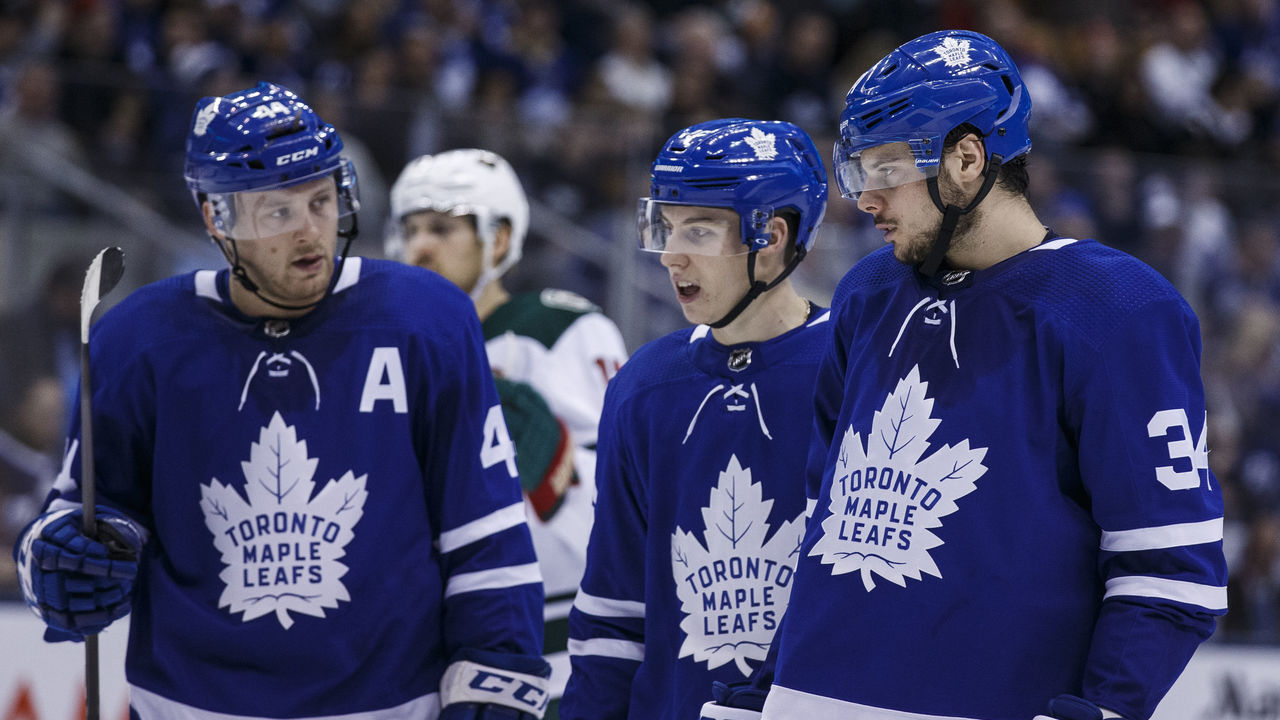
| 1 | TOR | 102.8 |
| 2 | WSH | 102.7 |
| 3 | NYI | 102.2 |
| 4 | PIT | 101.8 |
| T5 | ANA | 101.1 |
| T5 | TBL | 101.1 |
| RANK | TEAM | PDO |
|---|---|---|
| 27 | MIN | 98.8 |
| 28 | SJS | 98.3 |
| 29 | ARI | 98.1 |
| 30 | CAR | 97.8 |
| 31 | FLA | 97.7 |
Seeing the Maple Leafs at the top of the PDO list and near the bottom of the injury list doesn't mean they should expect poor puck luck or a slew of painful events over the next few months. However, those raw figures illustrate that Mike Babcock and his players haven't faced too much adversity in the early going, avoiding major injuries and clearly getting a fortuitous bounce or two. Compared to the Arizona Coyotes, whose season has been derailed by long-term ailments and a lack of scoring, Toronto is laughing.
Meanwhile, given where the San Jose Sharks rank in other categories - and their third-place spot in the Pacific Division - it's notable that they're 31st in man games lost. Along with being virtually injury-free, the first-half Sharks had the fourth-easiest schedule, according to Hockey Reference's strength of schedule metric, and tied for hitting the fifth-fewest crossbars/posts:
| RANK | TEAM | CROSSBARS | POSTS | TOTAL |
|---|---|---|---|---|
| 1 | VAN | 31 | 12 | 43 |
| 2 | CHI | 30 | 7 | 37 |
| T3 | MIN | 29 | 8 | 36 |
| T3 | VGK | 29 | 7 | 36 |
| 5 | DET | 30 | 5 | 35 |
| RANK | TEAM | CROSSBARS | POSTS | TOTAL |
|---|---|---|---|---|
| T26 | SJS | 18 | 4 | 22 |
| T26 | NSH | 15 | 7 | 22 |
| 28 | COL | 20 | 1 | 21 |
| T29 | OTT | 16 | 5 | 21 |
| T29 | NYR | 19 | 1 | 20 |
| 31 | NJD | 11 | 2 | 13 |
At the other end of the spectrum are the rebuilding Vancouver Canucks. Not only did Elias Pettersson, Bo Horvat, and friends hit the most posts and crossbars, they also faced stiff competition, tying the Edmonton Oilers and Chicago Blackhawks for the second-highest strength of schedule:
| RANK | TEAM | SOS |
|---|---|---|
| 1 | NJD | 0.11 |
| T2 | VAN | 0.07 |
| T2 | EDM | 0.07 |
| T2 | CHI | 0.07 |
| T5 | OTT | 0.06 |
| T5 | LAK | 0.06 |
| RANK | TEAM | SOS |
|---|---|---|
| T26 | WPG | -0.06 |
| T26 | FLA | -0.06 |
| 28 | SJS | -0.09 |
| 29 | VGK | -0.11 |
| 30 | CBJ | -0.11 |
| 31 | TBL | -0.14 |
An inch here, an inch there, and perhaps the Canucks have more than 44 points in 45 games. Can they capitalize on an easier second half, or is the franchise actually OK with misfiring? Would missing the playoffs and gaining a higher draft pick be a better scenario for the club?
The next few months in B.C. - and in the NHL's 30 other markets - should be intriguing.
John Matisz is theScore's National Hockey Writer. You can find him on Twitter @matiszjohn.


