How valuable are park factors in fantasy baseball?
Follow theScore's fantasy feed on Twitter (@theScoreFantasy) for the latest news, features and more.
You don't need a degree in physics to figure out why some parks favor hitters while others favor pitchers. Park Factors (PF) do the work for you, boiling a ballpark's impact on a specific outcome - the number of runs scored or home runs hit - into one easily understood number.
A neutral park will have have a PF of 1.000. Any factor above that mid-point favors hitters, while anything significantly below 1.000 is considered a pitcher's park. Like many stats, you can further break down PFs by handedness splits.
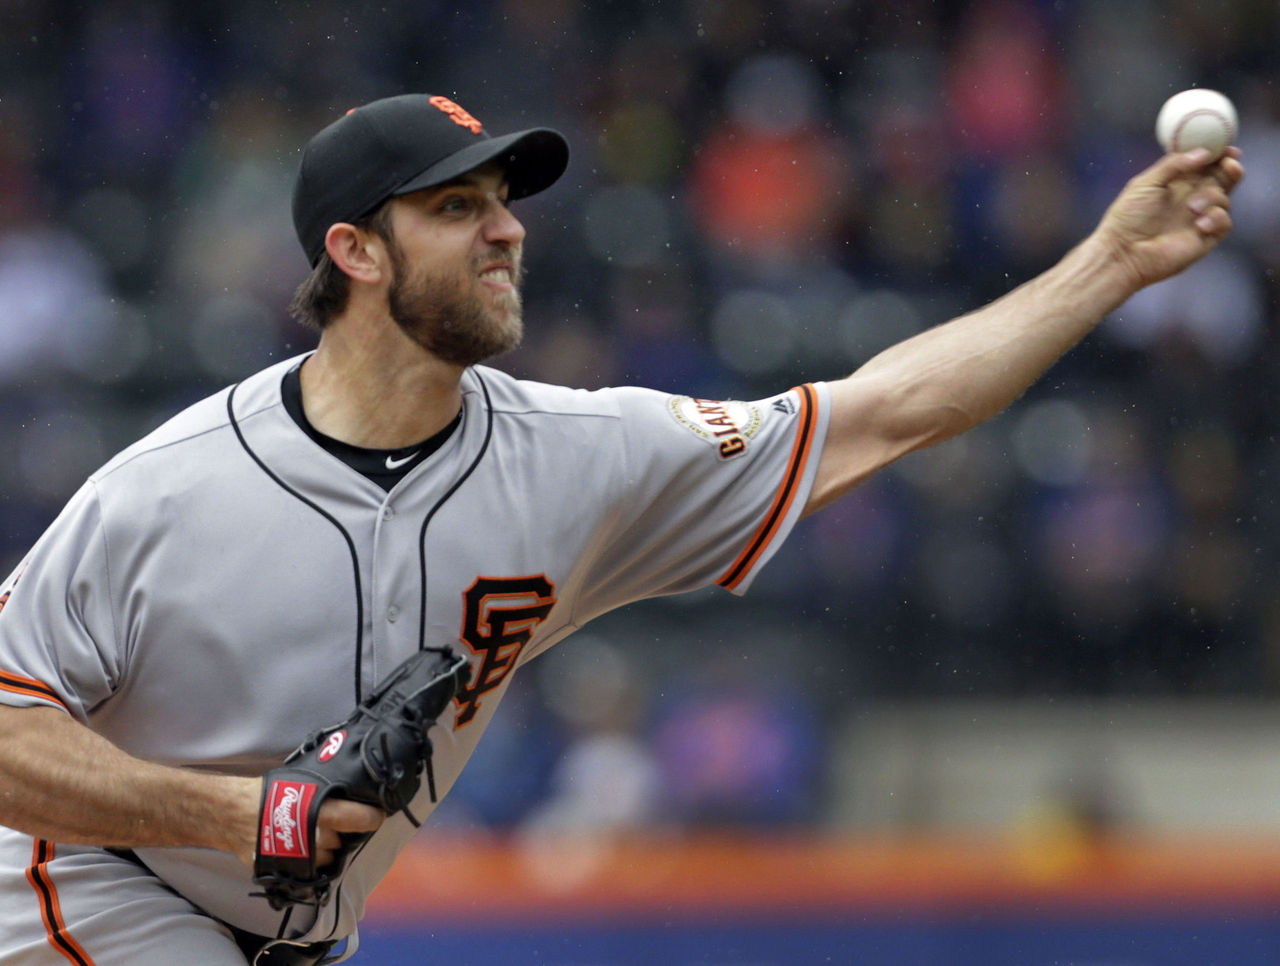
For instance, PFs may show that left-handed batters have really struggled to hit home runs at AT&T Park in San Francisco. That makes a lot of sense; while the right field foul line runs just 309 feet from home plate, the right field fence is 25 feet high, shielding McCovey Cove from the majority of fly balls pulled down the line by left-handed batters.
That means that left-handed pull-hitters that derive a substantial portion of their fantasy outlook from power numbers - OF Colby Rasmus, for example -- would see their fantasy outlook deteriorate if acquired by the Giants.

Extreme Stadiums
There are a number of notable extreme stadiums on either end of the spectrum. But first, let's get one thing out of the way...
Over the past three seasons, Coors Field has posted the highest park factors in runs, singles and triples, the third-highest PF in doubles and the fourth-highest PF in home runs. Even if you're the most casual of fantasy players, you've heard how the thin altitude in Colorado turns the Rockies' home stadium into a launching pad. We don't need to talk about it anymore.
Here are the top five hitter-friendly stadiums over the past three years, ranked by highest home run park factor:
| Stadium | Runs | HR |
|---|---|---|
| Citizen Banks Park (Phillies) | 1.024 | 1.277 |
| Miller Park (Brewers) | 1.071 | 1.272 |
| Yankee Stadium (Yankees) | 1.017 | 1.272 |
| Coors Field (Rockies) | 1.402 | 1.258 |
| Great American Ball Park (Reds) | 1.024 | 1.234 |
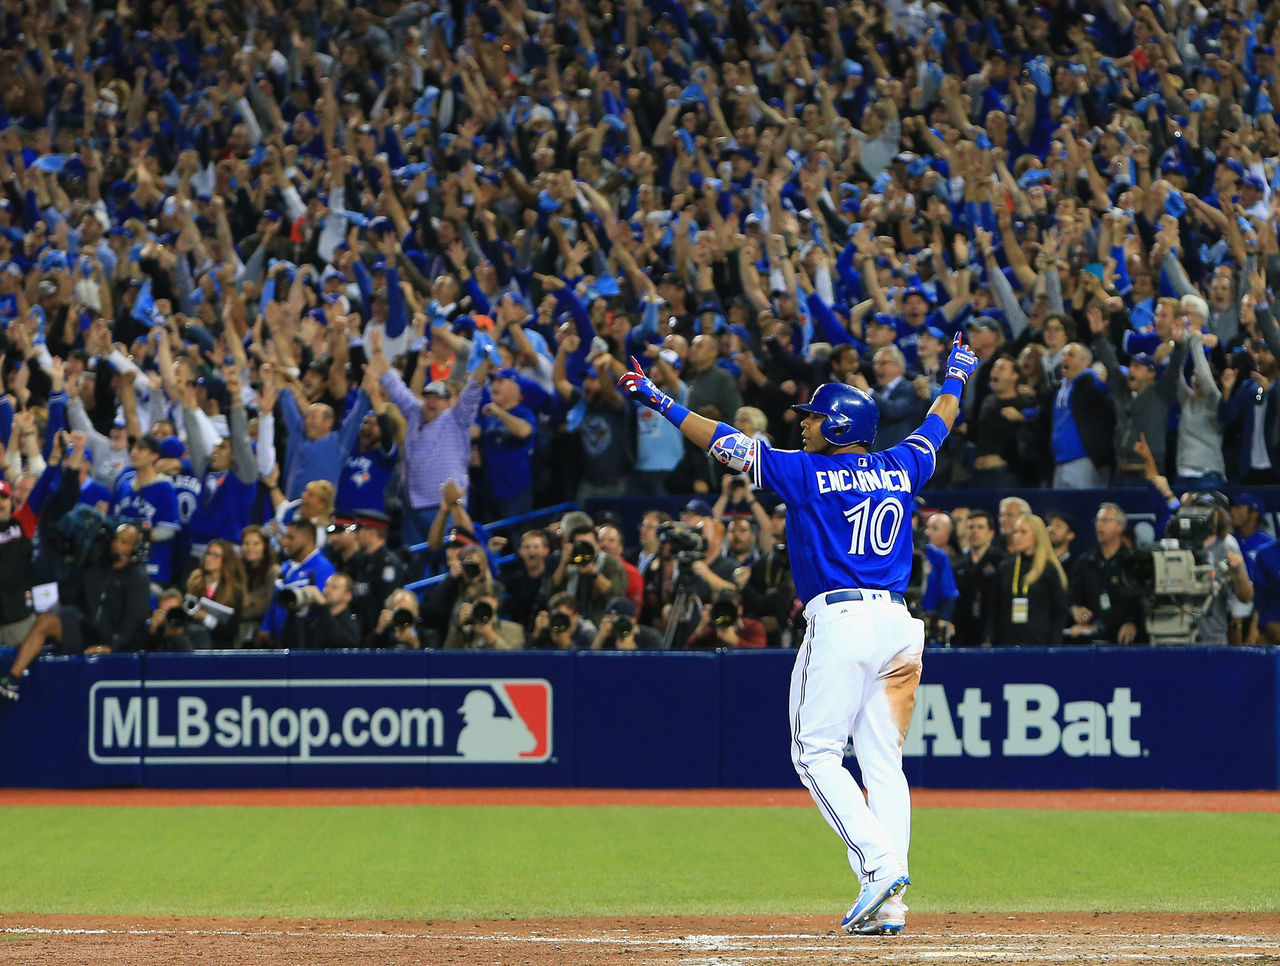
The AL East is home to three ballparks that rank highly in terms of home run factors. New York's Yankee Stadium has a home run PF of 1.272, Toronto's Rogers Centre comes in at sixth with a home run PF of 1.182, with Baltimore's Camden Yards just behind Toronto at 1.177.
We can expect new Blue Jay 1B/DH Kendrys Morales to see an uptick in home runs this season. He averaged 26 HRs over two seasons in Kansas City. The difference in PFs between Kansas City's Kauffman Stadium and the Rogers Centre can help you adjust your expectations when it comes to the Cuban slugger.

On the opposite end of the spectrum are ballparks with low park factors - veritable pitcher's paradises. Cavernous parks like the Padres' PETCO Park, the Giants' AT&T Park and Dodger Stadium all have a run factors below 0.900, meaning that NL West pitchers will spend many of their outings in parks that bolster their fantasy value.
A deep outfield and a good defense can help limit the opponents' ability to tally extra-base hits. A ballpark alone cannot make a pitcher great, but it can help shave a couple of points off his ERA. Here are the top five parks that suppress offense, ranked by lowest runs factor:
| Stadium | Runs | HR |
|---|---|---|
| Citi Field (Mets) | 0.862 | 1.021 |
| PETCO Park (Padres) | 0.864 | 0.952 |
| AT&T Park (Giants) | 0.877 | 0.680 |
| Dodger Stadium (Dodgers) | 0.898 | 1.054 |
| Safeco Field (Mariners) | 0.899 | 0.935 |

The One Major Drawback
The strongest case against using park factors to inform fantasy strategy is that the sample sizes just aren't large enough.
Take triple factor for example: over the past three years - a span of 7,290 regular season games - batters hit 2,661 triples, an average of just 88.7 per team since 2014. With relatively little data to draw from, it's possible for several players with the right combination of power, speed and luck to swing the impression of a ballpark. It's a chicken-and-egg conundrum.
Does the climate and design of Arizona's Chase Field help David Peralta and Chris Owings rank fourth and seventh in total triples over the past three seasons, or does their success give the false illusion that the Diamondbacks' home stadium is a triples factory?
Alternatively, is Dodgers Stadium really a pitcher's paradise, or does it owe its paltry 0.898 run factor to Clayton Kershaw and former Dodger Zack Greinke, exceptional pitchers that threw a combined 520 1/3 innings of sub-2.00 ERA at home from 2014-16?
Park factors are simple and accessible but can also be broad to a fault. They ignore the context of the players that have played the most games at a ballpark over the span of the sample size. Fenway Park has a home run factor of just 0.848, but Boston sluggers know how to adjust their swings to conquer the 37-foot Green Monster in left field. You can't learn that from park factors.
All Park Factors courtesy FantasyPros, based on data gathered over the past three seasons.