Which Scoring Categories Should You Really Be Using?
"The game is becoming a freaking joke because of the nerds who are running it."
- Rich "Goose" Gossage
While few serious baseball fans agree with the Hall of Fame reliever, fantasy baseball has undoubtedly become more fun and competitive for - and because of - these so-called nerds. The wealth of stats that have entered the conversation has created unlimited possibilities for groups of office workers, childhood friends or collections of internet-based basement dwellers.
Conventional fantasy baseball leagues follow a traditional, simple 5x5 format that includes these 10 categories:
Hitting: Home runs, RBIs, runs, stolen bases and batting average
Pitching: Wins, saves, strikeouts, ERA and WHIP
These stats are fine, but owners looking to move up a level in terms of competition need to consider either adding to or altering their league makeup. Here's a look at the best options for improving your fantasy league in 2016:
Hitting Stats
- OBP%
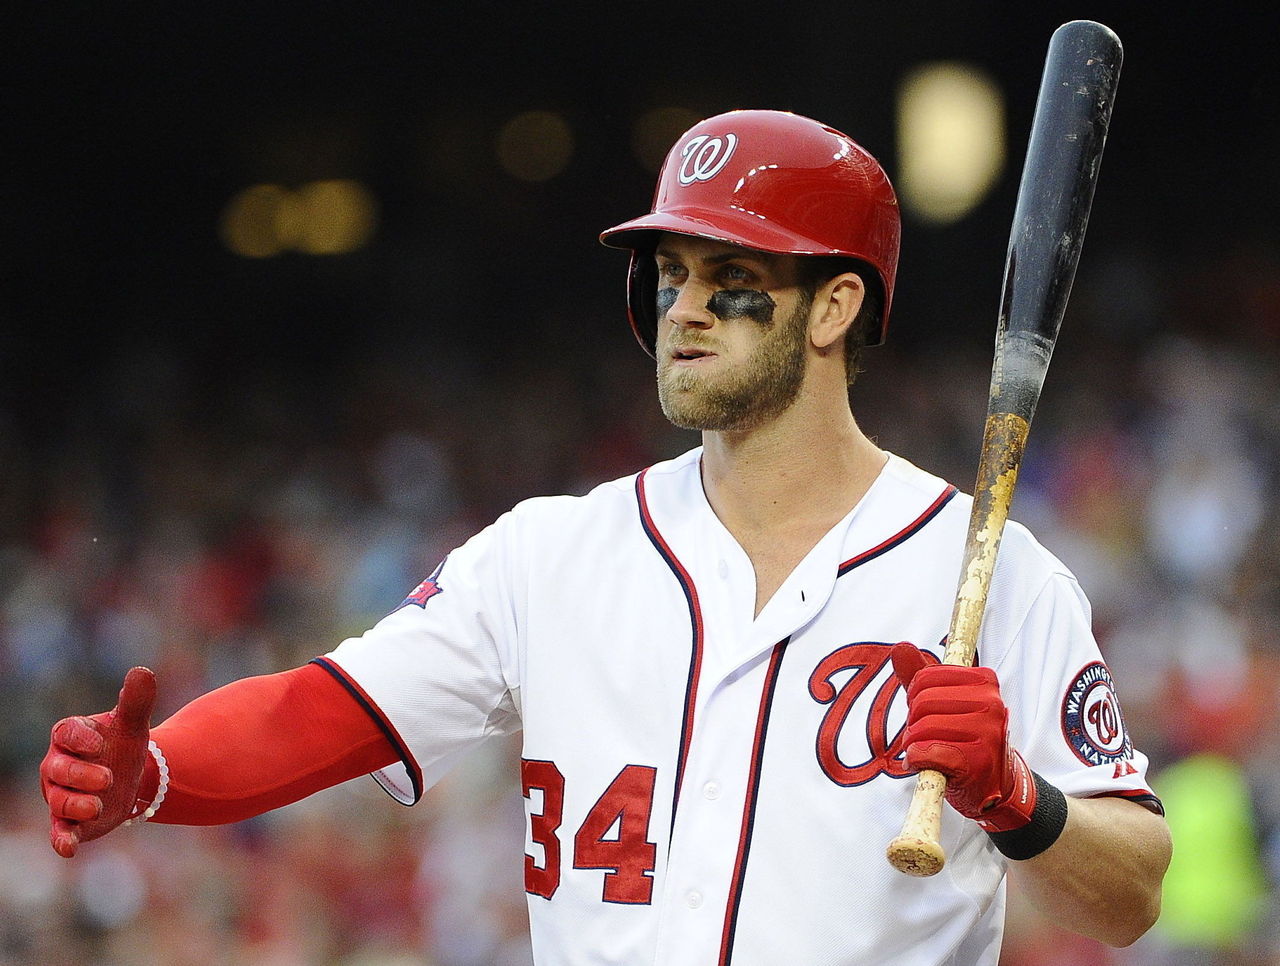
Of the top-10 hitters in on-base percentage last season, Chicago Cubs 1B Anthony Rizzo possessed the lowest batting average, at a very reasonable .278 rate. Going one spot lower to the 11th-highest OBP, Toronto Blue Jays OF Jose Bautista came in with a significantly worse .250 batting average.
Thanks to his .377 OBP, Bautista still accounted for a combined 182 runs - and 40 home runs - in 2015. Owners shouldn't be punished for a less than stellar batting average.
- SLG%
Cincinnati Reds 1B Joey Votto and Detroit Tigers 1B Miguel Cabrera were the only two players in the top-15 in slugging percentage last season who hit fewer than 30 home runs. Adding slugging percentage to your league in combination with OBP can compensate for a player's poor luck or injuries turning potential home runs into measly extra-base hits.
- OPS
Instead of adding OBP and SLG percentages to your league, combine both and use on-base plus slugging. Of the top-25 players in OPS last season, only three hit fewer than 20 home runs.
Eighty-one qualified hitters had an OPS above the league average mark of .750 last season. Of these players, none had fewer than 41 RBIs or 51 runs. OPS favors overall hitter production while removing the luck involved in RBI and run totals.
- Total Bases
Total bases is one more stat that can be used to negate the luck - good or bad - which can factor into home run totals.
Fifteen players out of 2015's top-50 in terms of total bases hit 20 or fewer home runs. Player No. 15 in those rankings was Cleveland Indians OF Michael Brantley, who hit just 15 home runs but had a league-leading 45 doubles. Arizona Diamondbacks OF David Peralta ranked 20th, with 241 total bases. He hit just 17 home runs but led the league with 10 triples.
- Net Stolen Bases
This category provides more value to stolen bases while emphasizing the best base stealers in the league. Players on bad teams or looking to receive a new contract will often attempt to pad their stats, and make some questionable decisions on the base paths.
To little surprise, Miami Marlins 2B Dee Gordon and Houston Astros 2B Jose Altuve led their respective leagues in both stolen bases and times caught stealing last season. Only seven players stole at least 25 bases while being successful on at least 80% of their attempts. Of these players, Reds OF Billy Hamilton was the top player - stealing 57 bases with an 87% success rate.
Pitching Stats
- Quality Starts
A quality start is defined as a game in which the pitcher goes at least six innings and allows no more than three earned runs.
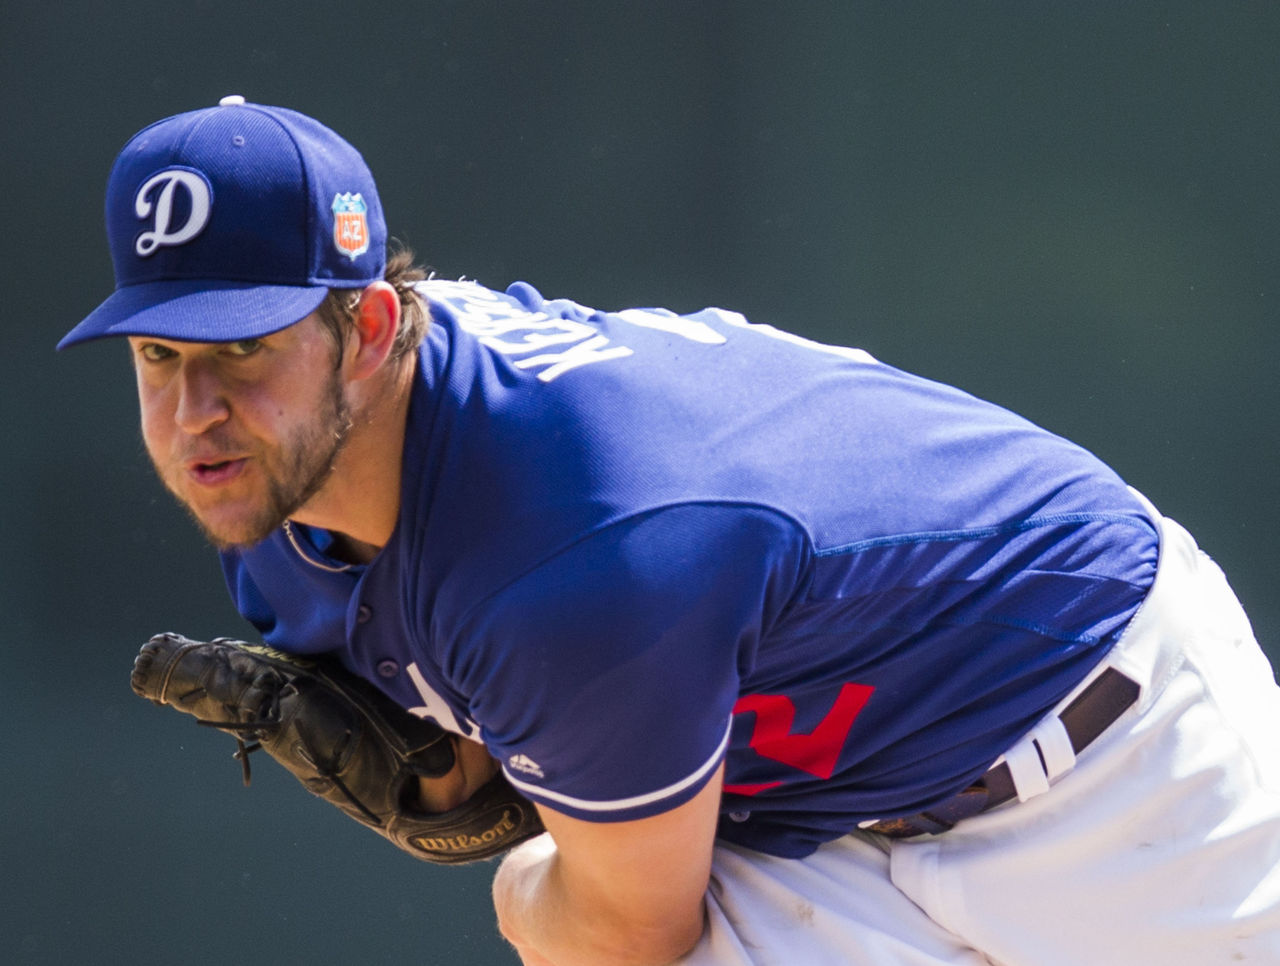
Two of the top four pitchers in quality starts last season led their respective league in wins. Two of them - including the MLB leader Zack Greinke - did not. Of the four, Los Angeles Dodgers ace Clayton Kershaw had the worst luck, coming third with 27 quality starts but picking up 16 wins.
Conversely, St. Louis Cardinals SP Michael Wacha finished 10th in the MLB with 17 wins, but he made just 19 quality starts.
- Complete Games
Looking at the 2015 leaders for complete games, ex-Blue Jays SP Mark Buehrle is the first name which doesn't feel like it belongs. Buehrle shared the league lead with four complete games last season though he had the worst peripheral stats of his peers.
Complete games come down to a variety of factors, many of which can be a result of luck. It is nice to have that extra bit of credit whenever your pitcher turns in that nine-inning gem.
- Holds
Of the top-15 relievers in strikeout rate last season, eight recorded at least 10 saves. Six recorded at least 10 holds, with the Astros' new closer Ken Giles being the only reliever to accomplish both. The new MLB trend of utilizing relievers in the most important situation, instead of in the ninth inning, has led to the league's best relievers not necessarily receiving save opportunities.
Holds is a way to still give credit to these players, especially those with the strikeouts and ratios to help a fantasy team in other ways.
- K/9
Here's another stat favoring relievers, but not necessarily closers. Many of the league's top relievers don't pitch enough innings over the course of a season to really factor in with standard strikeout totals. Using strikeout percentage as an alternative emphasizes their strength and overall value.
- K/BB
Minnesota Twins SP Phil Hughes turned in an impressive 16-win 2014 season, despite striking out just 7.98 batters per nine innings. His key to success was an astounding 0.69 BB/9 rate. As a result, he led the league with a sterling 11.63 K/BB ratio, while strikeout leader Kershaw was second at 7.71.
HEADLINES
- Durant, Rockets spoil Curry's 29-point return from injury
- Luka seeking specialized treatment in Europe to accelerate recovery
- Flagg becomes 1st rookie since Iverson with back-to-back 40-point games
- LaMelo's 35-point night leads Hornets to 4th straight win
- Pauley's pinch-hit double keys Marlins' comeback win over Yanks