Fantasy Faceoff: Craig Kimbrel vs. Aroldis Chapman
During the offseason, both the Yankees and Red Sox opted to turn over closing duties to two dominant finishers. The biggest question is, which player should be drafted first: Aroldis Chapman or Craig Kimbrel?
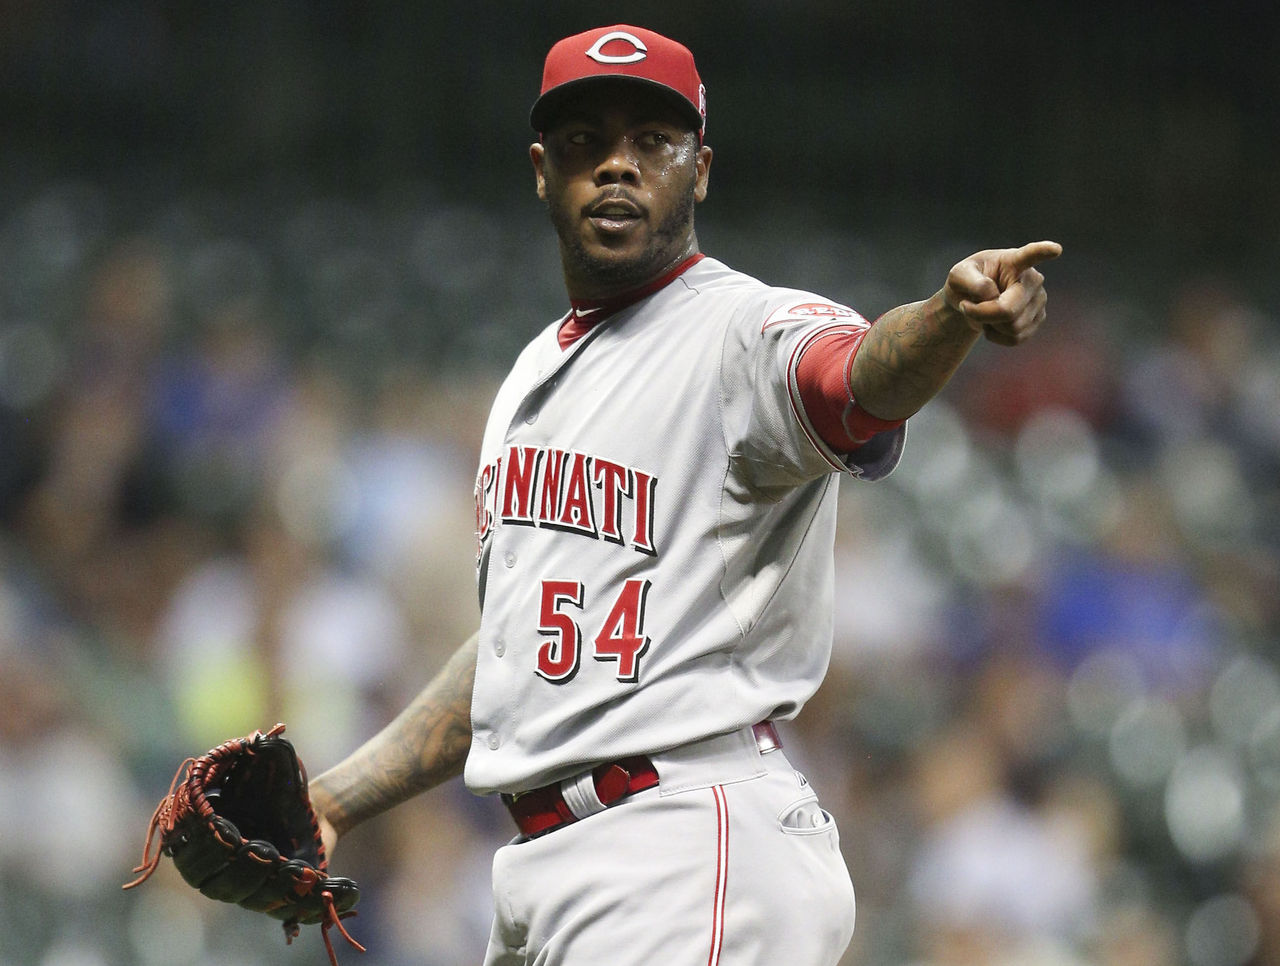
The stats below paint a picture of their previous seasons - Chapman with the Cincinnati Reds and Kimbrel with the San Diego Padres:
| NAME | IP | SV | K/9 | WHIP | ERA |
|---|---|---|---|---|---|
| Chapman | 66.1 | 33 | 15.7 | 1.15 | 1.63 |
| Kimbrel | 59.1 | 39 | 13.2 | 1.04 | 2.58 |
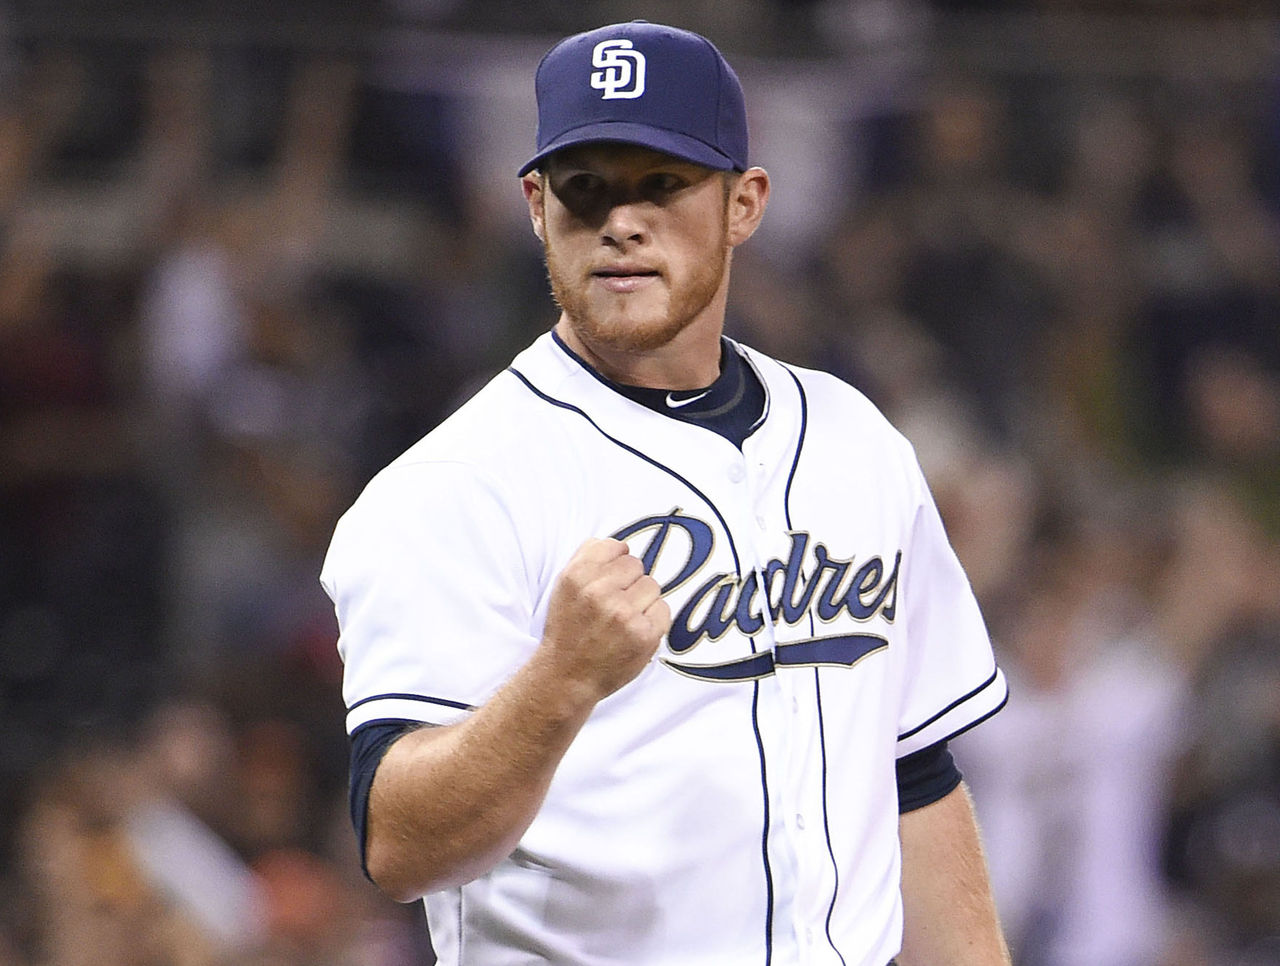
The Case for Kimbrel
Kimbrel led the majors in saves each year from 2011-14 and enters the season 39th in career saves with 225. At his five-year pace of roughly 45 saves per year, he can finish 2016 as high as 31st on the list. Based on sheer production, he's on pace to be one of the best closers of his generation.
MLB.com had to put a filter on their fastest pitch leaderboard because the top-30 results were all iterations of Chapman's 100-plus mph fastball. Chapman makes headlines for his absurd velocity, but Kimbrel is no slouch; his average fastball has clocked in at 97 mph for two straight years and he complements that power with a nasty curveball.
When it comes down to it, Kimbrel has saved far more games than Chapman - and that's the primary function of a closer.
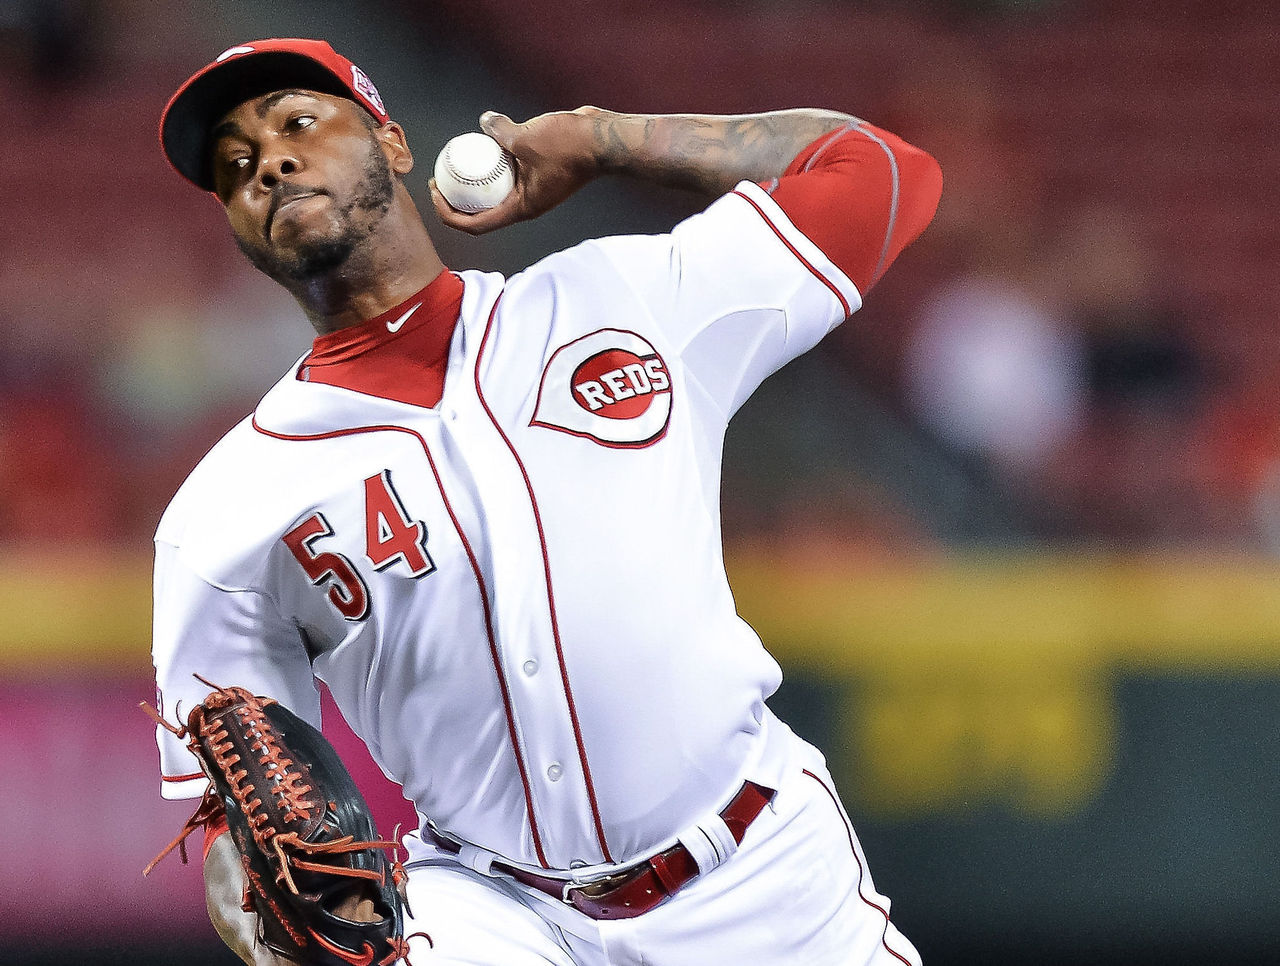
The Case for Chapman
Chapman was clearly on the inferior team; while the Padres finished a middling 74-88, the Reds were even worse at 64-98. More close games mean more opportunities for saves. When accounting for blown opportunities, Chapman saved 91.7% of his games, while Kimbrel came in at 90.7%.
In a standard head-to-head league with categories for wins, save, strikeouts, ERA and WHIP, Chapman had a big edge in both strikeouts and ERA, while remaining competitive in total saves and WHIP despite the state of his roster.
It says a lot about how the Yankees value Chapman that he's been named the team's closer despite the presence of All-Star relievers Andrew Miller and Dellin Betances.
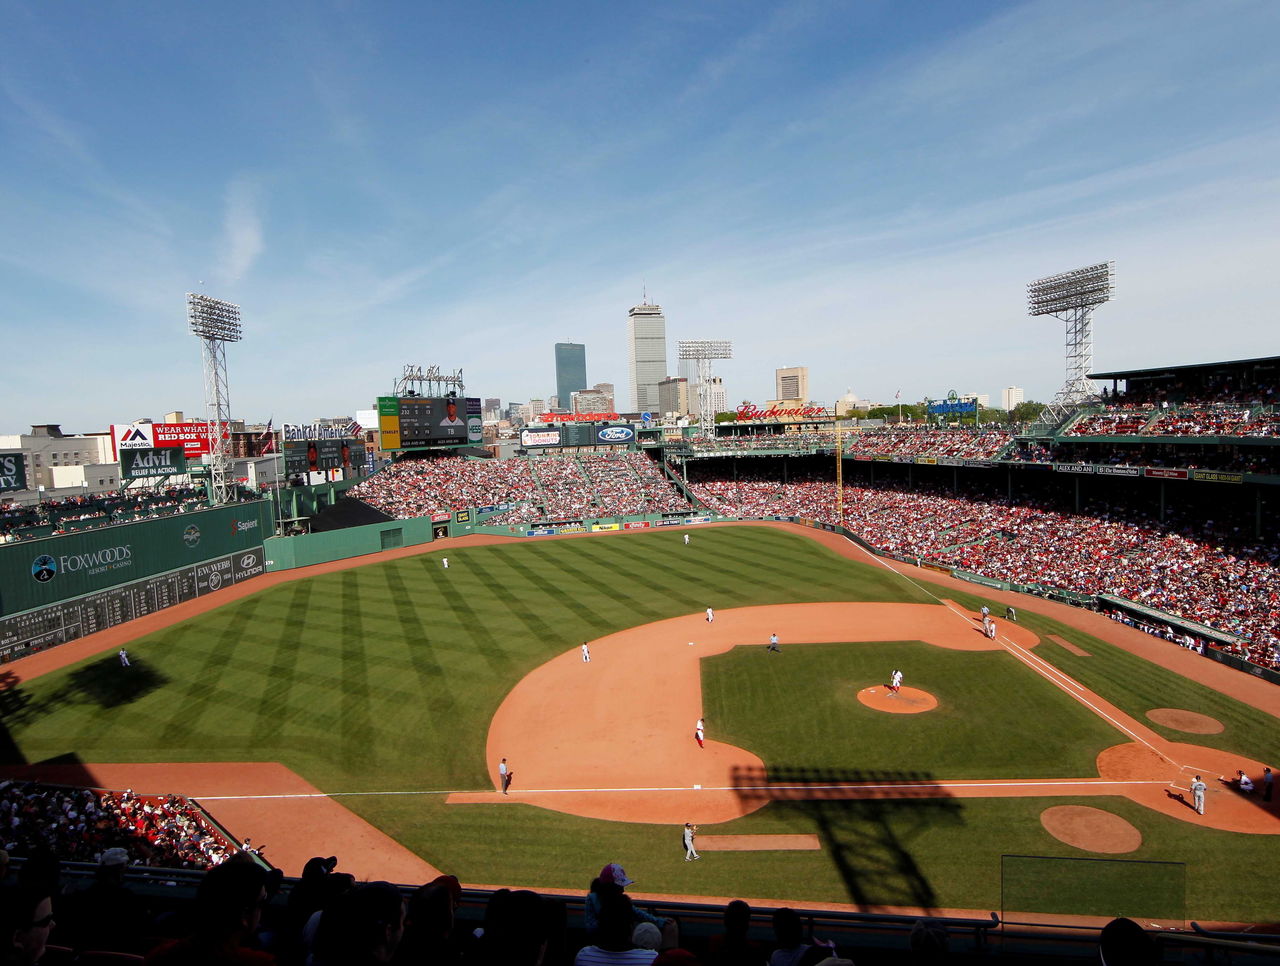
No Place Like Home
The biggest change for both pitchers is their new homes, where they'll pitch roughly half of their innings. Each ballpark in MLB has different dimensions and quirks that impact the game; fantasy players can get a better idea of how a stadium might affect pitchers and batters differently through park factors.
A park factor puts a number on the how a ballpark might impact a certain outcome. A neutral park factor, one that doesn't favor either hitters or batters, is given the factor 100; anything above 100 indicates an environment that favors hitters, while a factor below 100 is conducive to pitching.
Here are the 2015 park factors for the The Great American Ballpark (CIN), Yankee Stadium, Petco Field (SD) and Fenway Park (BOS):
| CIN | NYY | +/- | SD | BOS | +/- | |
|---|---|---|---|---|---|---|
| Park Factor | 102 | 101 | -1 | 95 | 105 | +10 |
Verdict
Both Chapman and Kimbrel moved into home ballparks that favor batters.
The key difference is that Chapman was already pitching half his games in a hitter's park in Cincinnati; in fact, Yankee Stadium rates as slightly less of a hitter's park. Kimbrel went from pitching in a true pitcher's park to pitching in the third-ranked hitter's park from last season.
With a proven track record in a tough environment, a better strikeout rate and a slightly stronger team around him, it becomes evident that Chapman, not Kimbrel, is the (slightly) better closer at the top of the pecking order. Though, his risk is tied to the fact that he'll miss the Yankees' first 30 games due to a suspension.