
Succeeding at daily fantasy baseball occasionally comes down to a tried-and-true real estate mantra: Location, location, location.
MLB DFS is often influenced by where games are being played - and considering park factors when building your lineup can make a significant difference in where you finish.
A quick look at offensive performance in the league’s 30 stadiums - also known as “park factors” - reveals that some venues are more conducive to higher-scoring games. The formula factors runs scored in each park compared to runs scored on the road, with a baseline of 1.000; anything higher favors the offense, while anything lower favors pitching and defense.
Here are the top five offensive parks from 2011-15 (stats courtesy ESPN):
2011
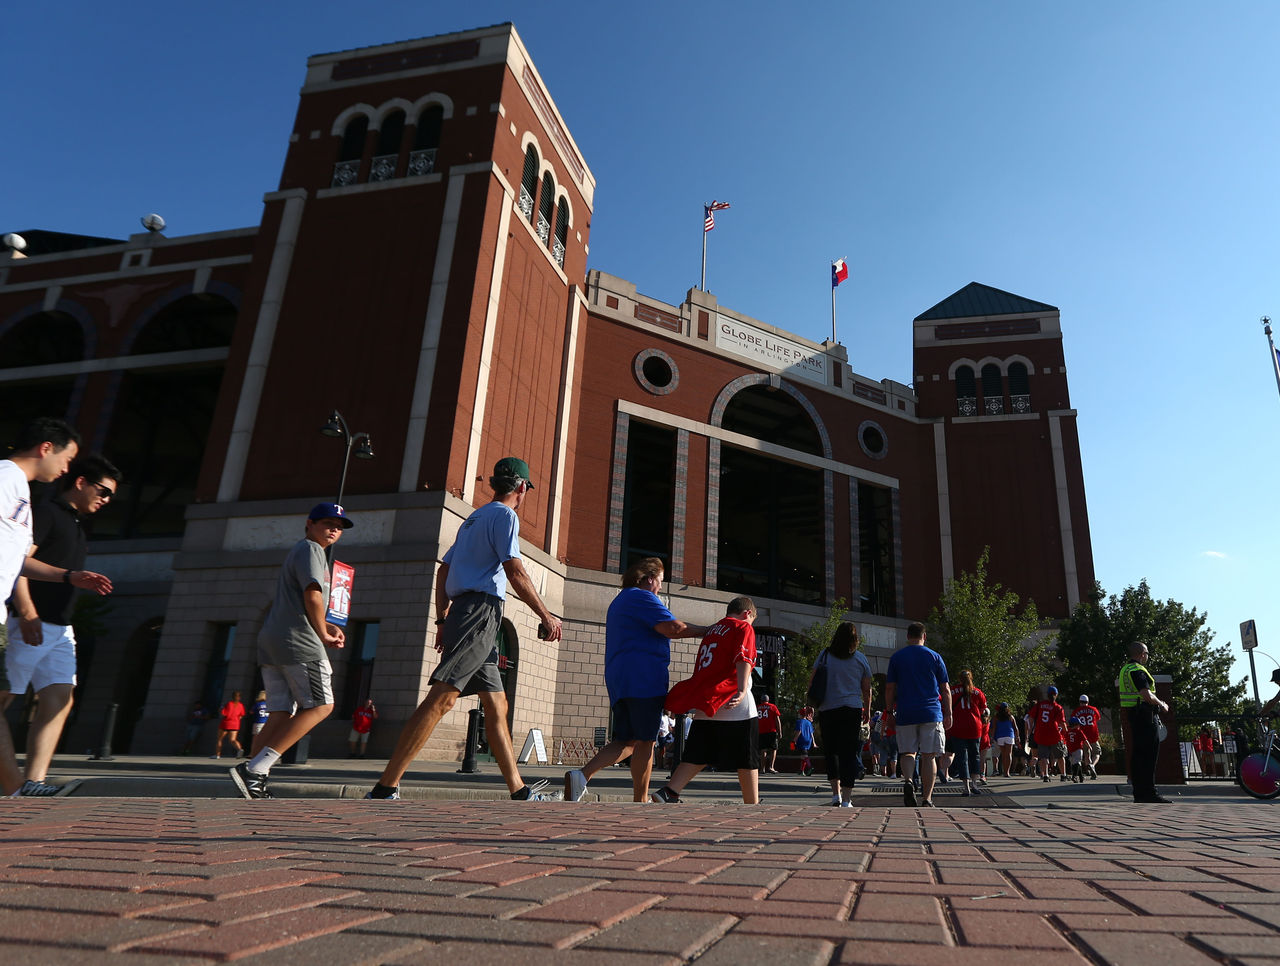
Globe Life Park in Arlington (Texas Rangers), 1.409
Coors Field (Colorado Rockies), 1.347
Fenway Park (Boston Red Sox), 1.173
Rogers Centre (Toronto Blue Jays), 1.152
Chase Field (Arizona Diamondbacks), 1.146
2012
Coors Field (Colorado Rockies), 1.579
U.S. Cellular Field (Chicago White Sox), 1.268
Fenway Park (Boston Red Sox), 1.206
Globe Life Park in Arlington (Texas Rangers), 1.183
Oriole Park at Camden Yards (Baltimore Orioles), 1.173
2013
Coors Field (Colorado Rockies), 1.273
Wrigley Field (Chicago Cubs), 1.192
Comerica Park (Detroit Tigers), 1.139
Rogers Centre (Toronto Blue Jays), 1.118
Miller Park (Milwaukee Brewers), 1.110
2014
Coors Field (Colorado Rockies), 1.501
Chase Field (Arizona Diamondbacks), 1.154
Target Field (Minnesota Twins), 1.116
Busch Stadium (St. Louis Cardinals), 1.100
Fenway Park (Boston Red Sox), 1.072
2015
Coors Field (Colorado Rockies), 1.436
Progressive Field (Cleveland Indians), 1.261
Oriole Park at Camden Yards (Baltimore Orioles), 1.228
Fenway Park (Boston Red Sox), 1.191
Globe Life Park in Arlington (Texas Rangers), 1.141
While the numbers vary from year to year for most parks, it’s clear that Coors Field is the league’s premier launching pad. DFS players often roster as many Rockies as possible whenever Colorado plays at home - and the inflated player prices reflect this demand.
An in-depth look at park factors can help you build a strong team without having to rely on Rockies players (or their opponents). Fenway Park has proven to be one of the top hitters’ venues in the league over the past five seasons, as has the Rogers Centre in Toronto, Globe Life Park in Arlington and Chase Field in Phoenix.
Some measure of park factors are affected by the quality of the home team’s offense - and to a lesser extent, its pitching and defense - in any given year. But parks that end up in the top 10 on a regular basis should be considered hitters’ havens no matter how good or bad the home team might be - and you should look at games in these parks as strong potential scoring contests.
Conversely, here are the five parks with the lowest marks since 2011:
2011
AT&T Park (San Francisco Giants), 0.737
Tropicana Field (Tampa Bay Rays), 0.817
Petco Park (San Diego Padres), 0.819
Angel Stadium of Anaheim (Los Angeles Angels), 0.836
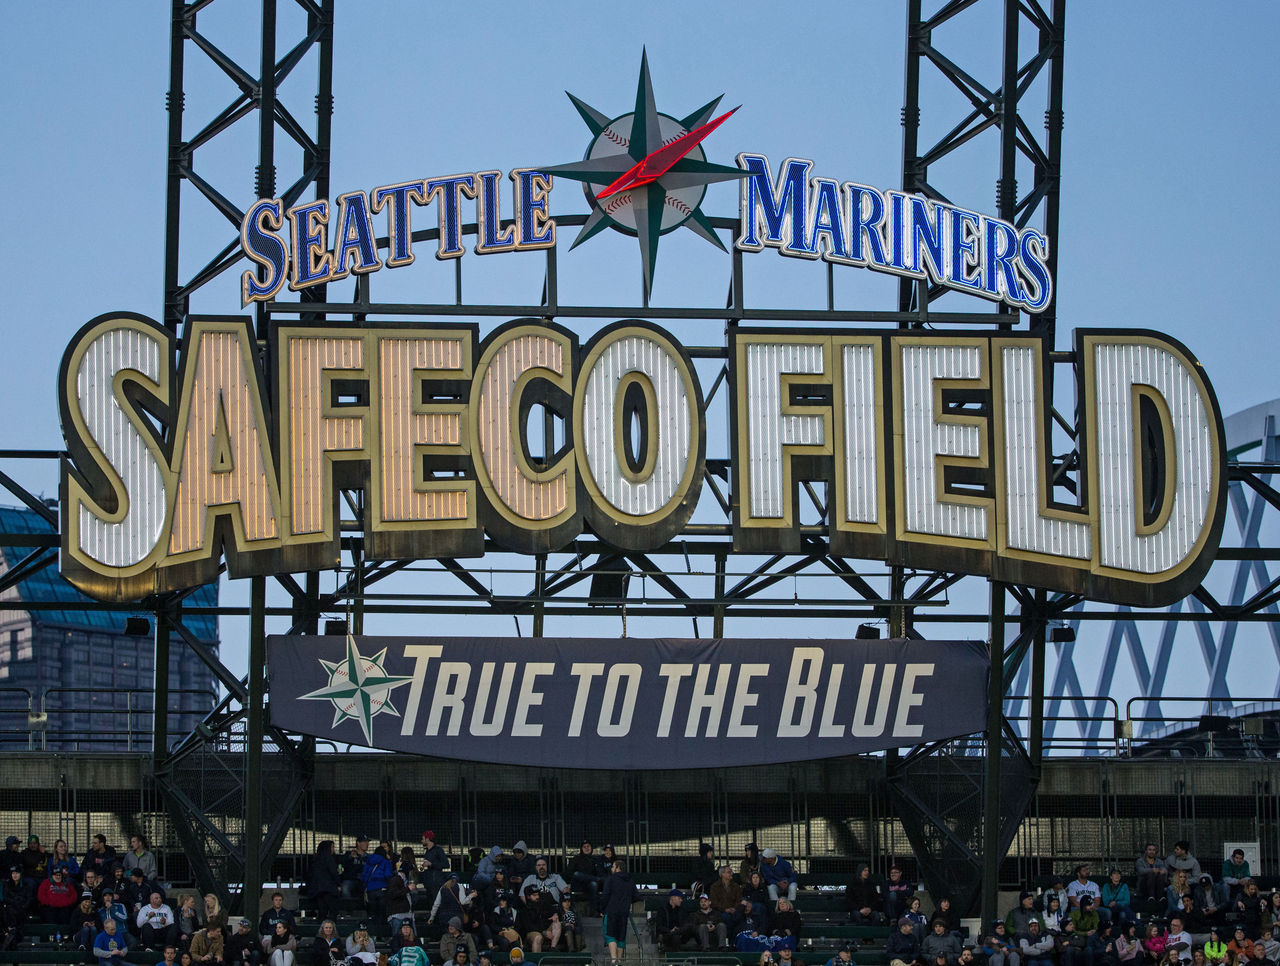
Safeco Field (Seattle Mariners), 0.855
2012
Safeco Field (Seattle Mariners), 0.687
AT&T Park (San Francisco Giants), 0.737
PNC Park (Pittsburgh Pirates), 0.764
Angel Stadium of Anaheim (Los Angeles Angels), 0.812
Petco Park (San Diego Padres), 0.854
2013
Petco Park (San Diego Padres), 0.831
Citi Field (New York Mets), 0.867
Dodger Stadium (Los Angeles Dodgers), 0.868
AT&T Park (San Francisco Giants), 0.869
O.co Coliseum (Oakland Athletics), 0.889
2014
Safeco Field (Seattle Mariners), 0.825
Petco Park (San Diego Padres), 0.826
Citi Field (New York Mets), 0.847
Dodger Stadium (Los Angeles Dodgers), 0.907
Angel Stadium of Anaheim (Los Angeles Angels), 0.919
2015
AT&T Park (San Francisco Giants), 0.845
Angel Stadium of Anaheim (Los Angeles Angels), 0.861
Citi Field (New York Mets), 0.870
Safeco Field (Seattle Mariners), 0.878
Comerica Park (Detroit Tigers), 0.902
The main theme: don’t get too attached to hitters playing on the West Coast. Petco Park, Angel Stadium of Anaheim, Safeco Field, AT&T Park and Dodger Stadium all have reputations of suppressing offense compared to the league average, making them terrific breeding grounds for strong pitching performances - and undesirable options for most hitters.
Some important things to consider when evaluating park factors:
- Great hitters can mash anywhere, so don’t fade an elite option just because he’s playing in an offense-suppressing park. Additionally, top hitters’ ownership percentages tend to be lower in those stadiums, making them attractive contrarian options.
- Don’t fall into the trap of thinking that any pitcher starting in a low-offense park is automatically safer than one who isn’t. Just as great hitters can be great anywhere, bad pitchers will struggle no matter how offense-suppressing the park might be.
- Breaking down park factors by hit type is also handy; for example, Fenway Park has been the best “doubles” park in baseball since 2011. So if you’re looking for value, you may want to consider hitters playing in Boston who have gap power.
- Always take the weather conditions into consideration. A strong wind blowing into home plate can make even the most homer-friendly stadium far more treacherous. Conversely, a wind blowing toward the outfield can greatly enhance run scoring in any park.