Value charts: Where can you afford to wait?
Fantasy football drafting is by no means a science. Superstars bust and 'nobodies' break out each and every year, allowing your Uncle Larry or Barb from your office to win the pool in their very first season playing any type of fantasy sports. It's unavoidably frustrating and incredibly fun at the same time.
While individual player performance will always remain highly variant, analyzing the different positions as a whole can help to mitigate risk or at least provide a look at where in drafts each position should be addressed. Here we'll look at ADP data, courtesy of MyFantasyLeague.com, from each of the past three draft seasons and compare them to end-of-season results.
Positions are broken down to starting fantasy positions, with the data focused on the top 12 quarterbacks and tight ends, the top 24 running backs (RBs 1 and 2) and the top 36 wide receivers (WRs 1, 2 and 3).
(NAs are players without an ADP; a value of 200 is used to determine average)
Quarterback
| QB | Avg. | High | Low |
|---|---|---|---|
| 1 | 49 | 85 | 27 |
| 2 | 34 | 70 | 14 |
| 3 | 97 | 164 | 16 |
| 4 | 36 | 57 | 10 |
| 5 | 101 | 144 | 38 |
| 6 | 96 | 156 | 47 |
| 7 | 75 | 99 | 60 |
| 8 | 118 | 152 | 76 |
| 9 | 115 | 203 | 43 |
| 10 | 106 | 144 | 70 |
| 11 | 143 | 213 | 57 |
| 12 | 50 | 85 | 13 |
While there is a measure of safety in selecting the early quarterbacks, the chances of an early-round QB finishing as QB1 or QB12 were nearly identical; the earliest quarterback drafted in the three-year span finished as QB12.
Extremely late QB selections are unlikely to finish higher than QB8 but the first quarterback taken finished higher than QB4 just once in the past three seasons. Selecting a quarterback early on will help mitigate risk at the position but addressing other positions while waiting on quarterbacks offers similar floors and upsides.
Running Back
| RB | Avg. | High | Low |
|---|---|---|---|
| 1 | 48 | 115 | 9 |
| 2 | 15 | 30 | 4 |
| 3 | 31 | 64 | 12 |
| 4 | 53 | 143 | 8 |
| 5 | 77 | 149 | 25 |
| 6 | 14 | 31 | 2 |
| 7 | 43 | 75 | 4 |
| 8 | 129 | NA | 38 |
| 9 | 46 | 100 | 17 |
| 10 | 98 | 135 | 32 |
| 11 | 80 | 131 | 3 |
| 12 | 90 | 187 | 18 |
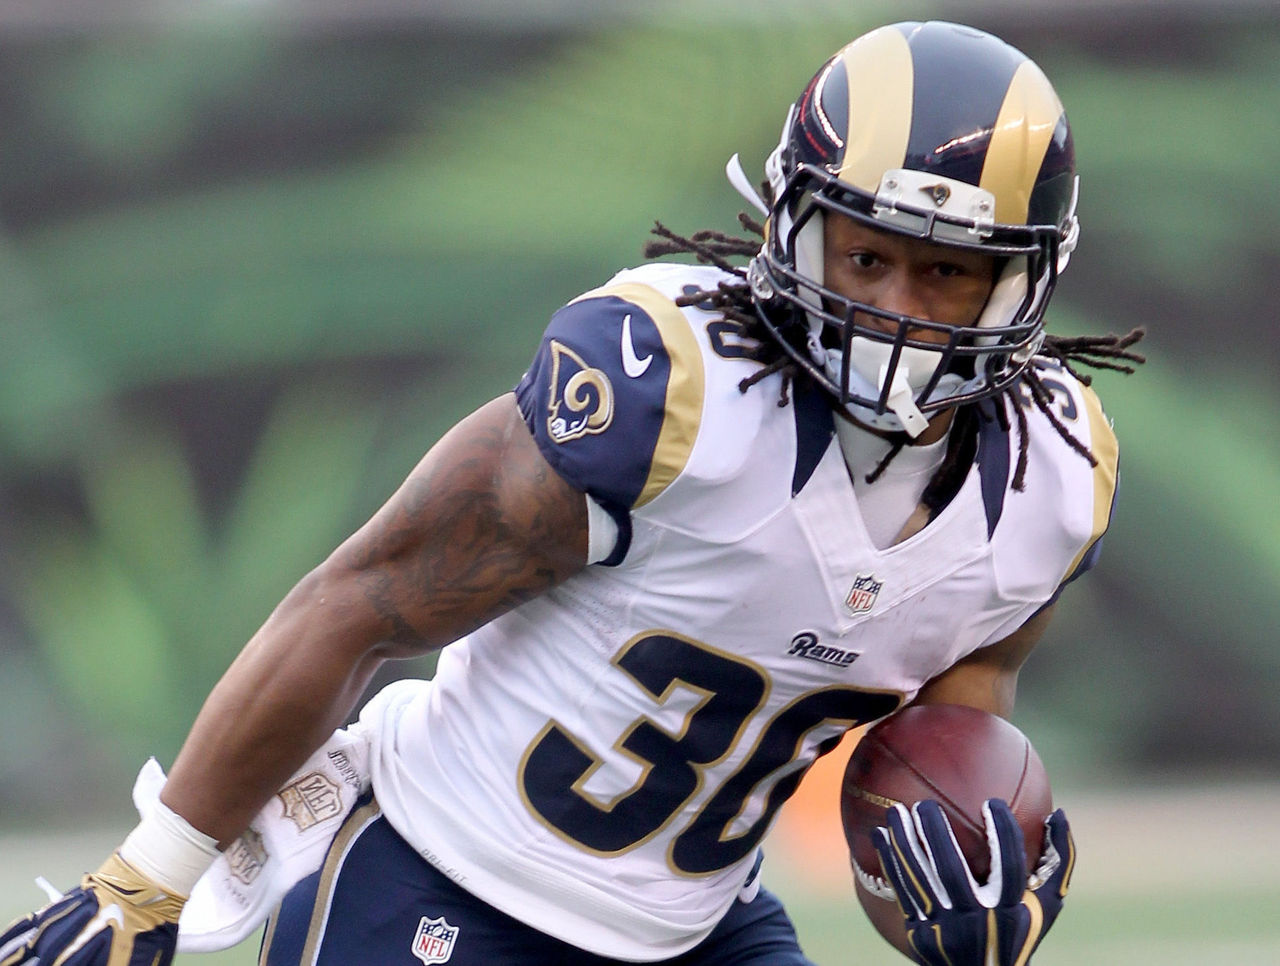
Selecting an RB1 is difficult. The volatility of the position has been oft-discussed across the Internet and the gamble of picking a running back early in drafts is clearly displayed from the last three seasons.
The first running back selected never finished as the top-performing RB in the three-year sample, but selecting one of the first 12 RBs taken in a draft typically warranted an RB1 finish.
The number of late-round selections to turn in an RB1 season illustrates the importance of loading up on rushers as late-round lottery tickets. Because we can never be 100 percent on the success rate of handcuffs or sleepers, owners should choose quantity, especially at this most volatile of positions.
| RB | Avg. | High | Low |
|---|---|---|---|
| 13 | 33 | 35 | 30 |
| 14 | 49 | 73 | 15 |
| 15 | 76 | 123 | 21 |
| 16 | 46 | 70 | 14 |
| 17 | 148 | NA | 89 |
| 18 | 113 | 170 | 23 |
| 19 | 146 | 150 | 139 |
| 20 | 104 | NA | 28 |
| 21 | 132 | 169 | 89 |
| 22 | 117 | 193 | 5 |
| 23 | 140 | 181 | 96 |
| 24 | 148 | NA | 86 |
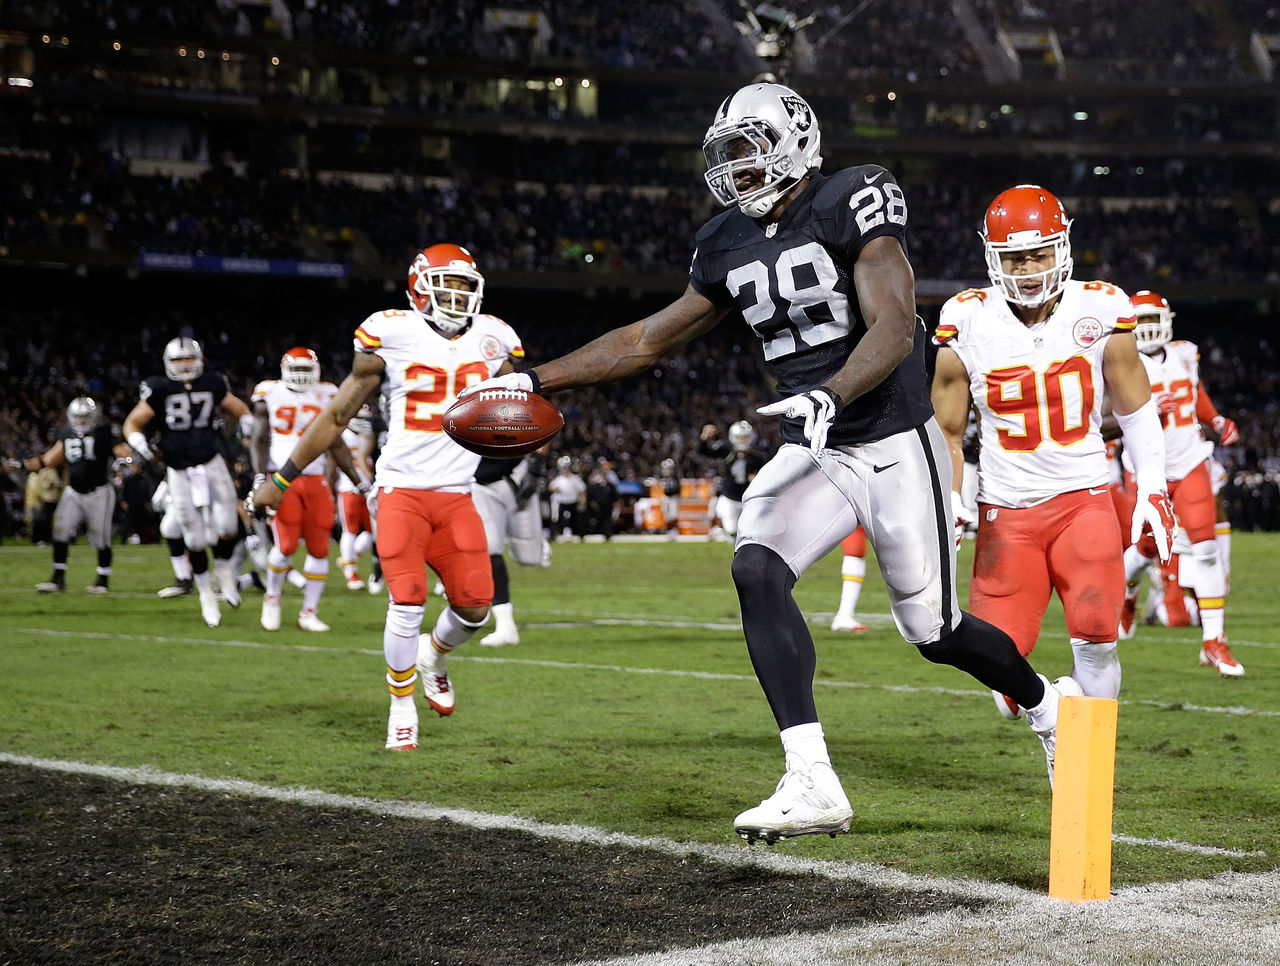
Only 20 backs taken within the first 24 picks in each of the past three seasons finished the year ranking inside the top-24 at the position. Selecting a back with a high pick doesn't even guarantee an RB2 result, as it seems when running backs bust, they really bust.
With so many late-round RBs climbing their way up the standings every year, owners need to stock their bench with players beginning the season as the second or third option on the depth chart of their respective NFL team. These players should be stashed for the first couple weeks of the season, as they may not always receive an immediate opportunity.
Wide Receiver
| WR | Avg. | High | Low |
|---|---|---|---|
| 1 | 46 | 100 | 9 |
| 2 | 21 | 25 | 15 |
| 3 | 30 | 65 | 9 |
| 4 | 38 | 85 | 11 |
| 5 | 68 | 167 | 14 |
| 6 | 30 | 39 | 18 |
| 7 | 97 | 157 | 65 |
| 8 | 34 | 61 | 19 |
| 9 | 98 | 131 | 72 |
| 10 | 50 | 70 | 18 |
| 11 | 93 | 114 | 57 |
| 12 | 31 | 33 | 28 |
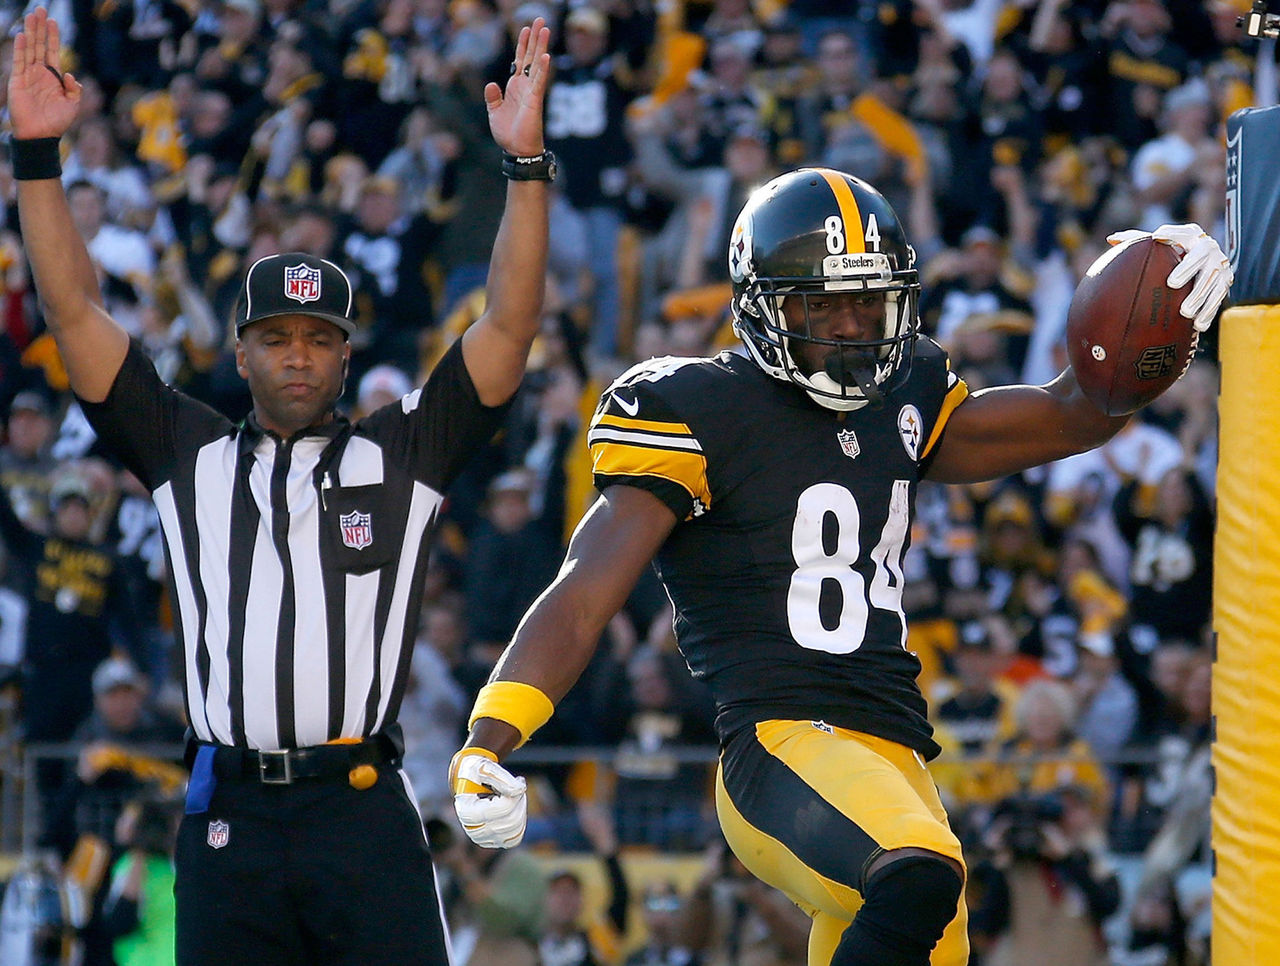
There are two major takeaways from the three-year sample of WR1 performances. High draft picks have typically lived up to their billing and few late-round picks have worked their way up to a high finish. Owners should be targeting the elite wide receivers early in drafts, and avoiding the temptation to gamble on rookies or lesser-known talents late in drafts.
| WR | Avg. | High | Low |
|---|---|---|---|
| 13 | 56 | 93 | 14 |
| 14 | 114 | 182 | 40 |
| 15 | 52 | 89 | 8 |
| 16 | 65 | 107 | 30 |
| 17 | 104 | 187 | 56 |
| 18 | 100 | 178 | 37 |
| 19 | 62 | 78 | 39 |
| 20 | 116 | 158 | 43 |
| 21 | 133 | NA | 16 |
| 22 | 116 | 186 | 58 |
| 23 | 99 | 127 | 50 |
| 24 | 117 | 185 | 25 |
A few more late-round receivers were able to turn in a WR2 season, but most of the tier is made up of receivers who were drafted to serve the role. There is plenty of depth at the top of the wide receiver position.

| WR | Avg. | High | Low |
|---|---|---|---|
| 25 | 117 | NA | 65 |
| 26 | 79 | 153 | 33 |
| 27 | 90 | 155 | 45 |
| 28 | 62 | NA | 37 |
| 29 | 152 | 179 | 114 |
| 30 | 184 | NA | 151 |
| 31 | 94 | NA | 22 |
| 32 | 118 | NA | 75 |
| 33 | 86 | 189 | 19 |
| 34 | 168 | NA | 114 |
| 35 | 141 | NA | 94 |
| 36 | 141 | 191 | 44 |
This is the tier where the undrafted wild-cards begin to emerge. Owners should pass on the overhyped rookies who see their respective ADPs soar during the preseason, and instead seek out some rookies who may have gone later in the NFL Draft but are in better situations to see immediate playing time or are in offenses with better quarterbacks.
Alternatively, owners can look at veteran receivers who are being written off too early by the majority of fantasy owners and are likely to rejuvenate their careers either on a new team or in a new role.
Tight End
| TE | Avg. | High | Low |
|---|---|---|---|
| 1 | 24 | 33 | 15 |
| 2 | 122 | 170 | 61 |
| 3 | 124 | NA | 12 |
| 4 | 71 | 93 | 56 |
| 5 | 120 | 124 | 117 |
| 6 | 116 | 165 | 60 |
| 7 | 137 | NA | 30 |
| 8 | 106 | 161 | 63 |
| 9 | 141 | 163 | 104 |
| 10 | 104 | 133 | 72 |
| 11 | 144 | NA | 107 |
| 12 | 143 | NA | 84 |
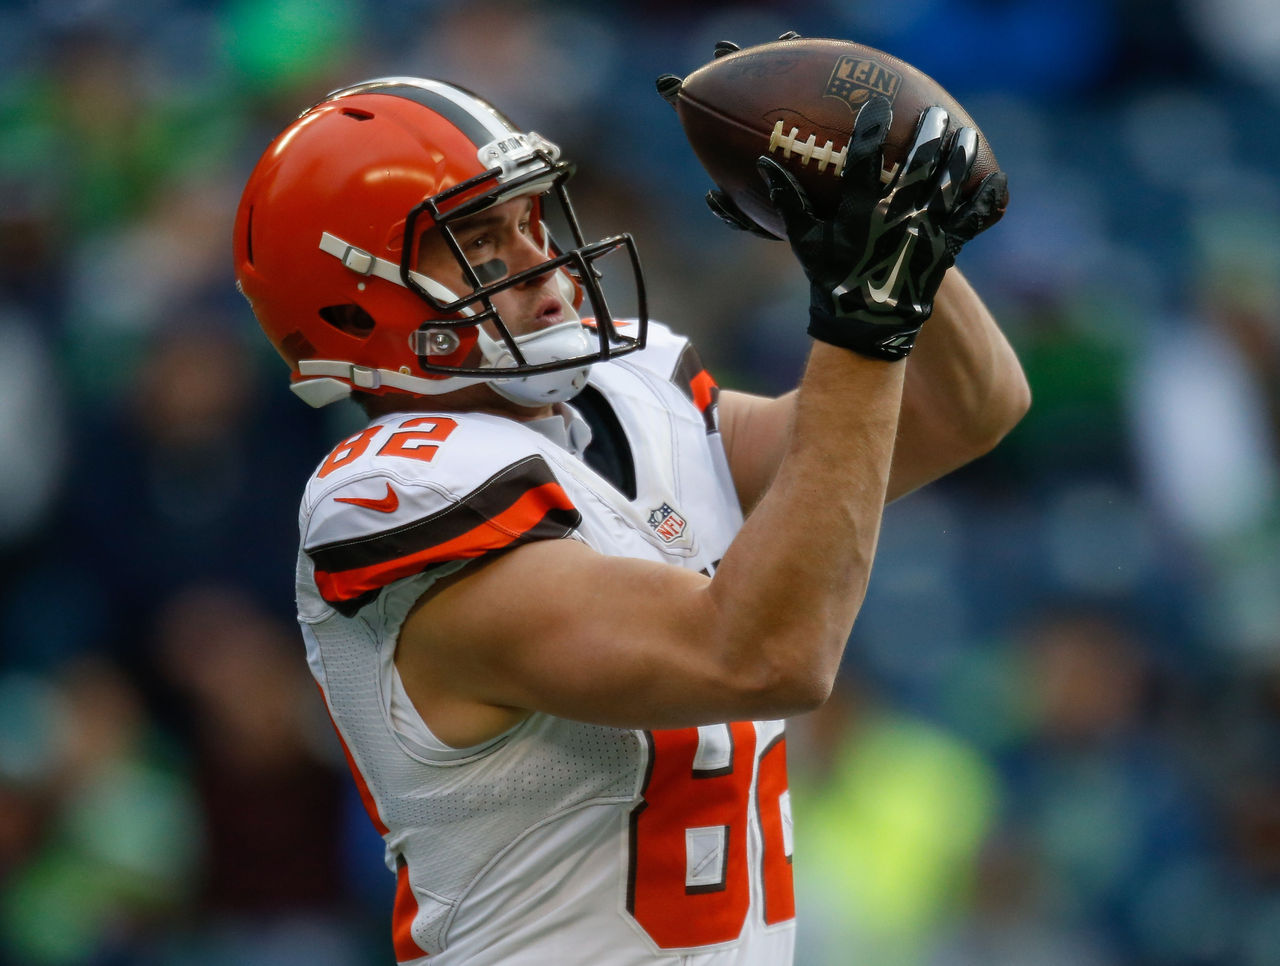
The first tight end drafted finished as the top player at the position in two of the three years in the sample, while in 2014 the first TE selected finished the season as TE3.
Investing a lot of draft capital in a tight end is a safe move for locking up the best player at the position but waiting can return a near-equal amount of value, while addressing the more important fantasy positions with earlier picks.
Here's what to look for when targeting a late-round tight end.