The 2018 NHL season will finish with a first-time winner hoisting the Stanley Cup.
The expansion-club phenoms out of Vegas are in one corner, having defied all odds during a historic march to the Stanley Cup Final. In the other corner are the Washington Capitals, a team that's punched its ticket to the final for the first time since 1998 after years of heartbreak.
The Golden Knights have opened as favorites. But, as this roster breakdown shows, the matchup may be a little tighter than it appears.
Forwards
During the Western Conference Final, the Golden Knights took out a Winnipeg Jets offense that was ranked second in the regular season.
Now they'll have to match the firepower of a Capitals' forward group that's been far more dangerous during the playoffs.
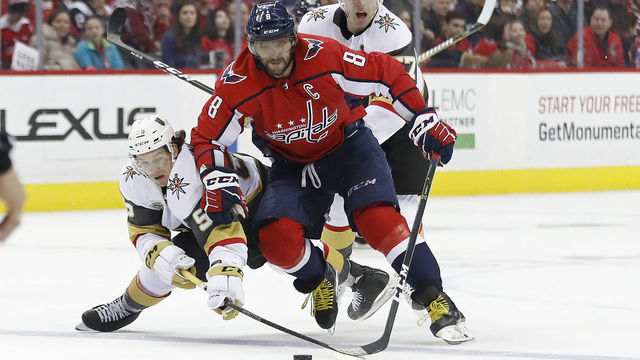
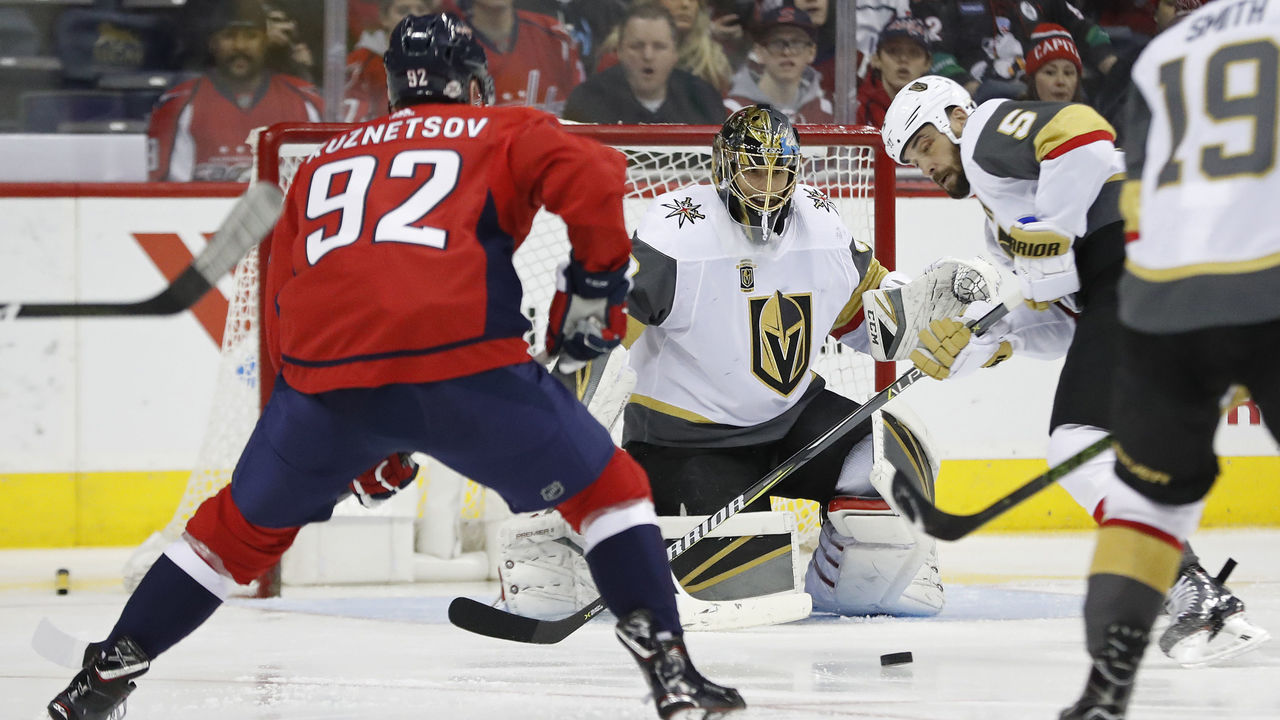
Each team is led by a first line that has done some heavy lifting. For the Capitals, their top trio of Alex Ovechkin, Evgeny Kuznetsov, and Tom Wilson have combined for 58 playoff points. Meanwhile, Vegas has been spearheaded by Jonathan Marchessault, William Karlsson, and Reilly Smith, who have piled up 47 points. Those two top lines are nearly a wash considering the difference in games played (a combined 54 by the Capitals' top three, and 45 by Vegas' lead unit).
Related: Knights' and Capitals' top lines take very different routes to dominance
However, overall, the Capitals have outscored Vegas forwards 59-35, potting 24 more goals in just four more games, and averaging 3.11 goals per game compared to the Golden Knights' 2.33.
Edge: Capitals - The Golden Knights forwards have done exactly what they've needed, but the Capitals stars have been more lethal in their pursuit of glory.
Defense
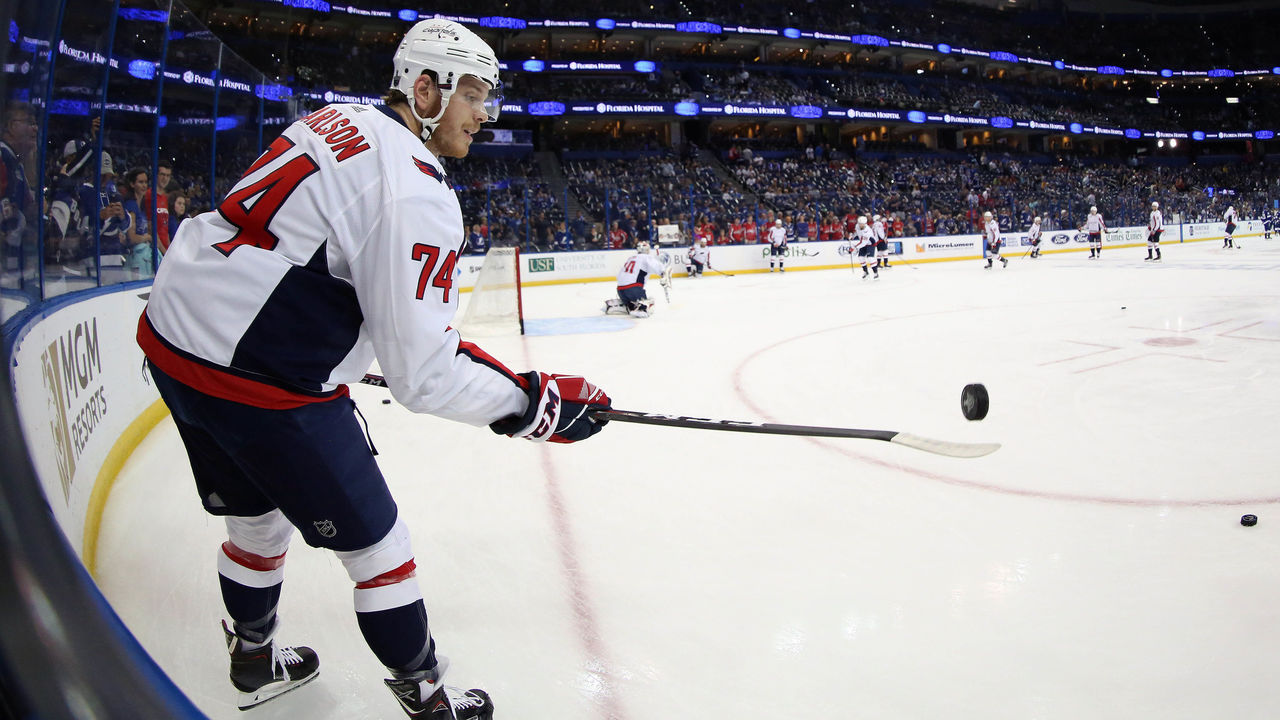
The Golden Knights' defense has accumulated 23 playoff points, while John Carlson alone has put up 16 points for the Capitals, that says all you need to know about the matchup on defense.
Overall, Washington's blue-liners have scored one fewer goal than the Golden Knights' backend (7), but 16 more points. They've also fired 192 shots at the opposition, much more than Vegas' 115.
On the opposite side of the puck, the Capitals have averaged 28.2 shots against per game, the second-fewest in the playoffs. Meanwhile, the Golden Knights have given up the fifth-most at 33.7 per game and are also averaging 9.87 high-danger scoring chances against per game at five-on-five in the playoffs compared to the Capitals' 8.84.
Edge: Capitals - Whether it be on the scoreboard or in their own end, the Capitals' defense has been more effective than that of the Golden Knights.
Goalies
After starting the postseason on the bench behind Philipp Grubauer, Braden Holtby has come alive.
He's returned to his Vezina-winning form after a regular season that was a career-worst statistically. Riding back-to-back shutouts as he enters the Stanley Cup Final, Holtby has posted a .923 save percentage (third in the playoffs among goalies with five appearances) and a 2.04 goals-against average (second).
There's just one problem: The man who occupies the top spot in both those categories will be staring him down from the opposite end of the rink.
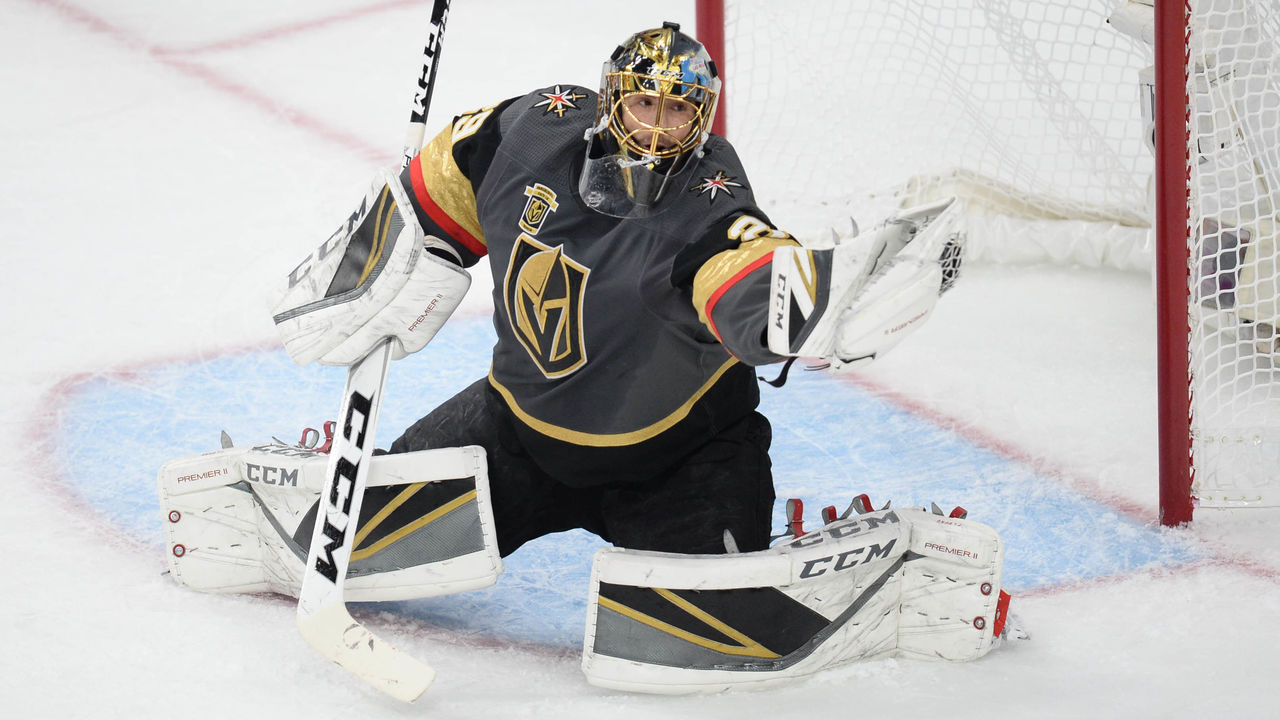
Marc-Andre Fleury leads the postseason with a .947 save percentage and a 1.68 goals against average, putting up four shutouts along the way. His save percentage sits as the seventh-best postseason mark among any goalie to play at least six games during a single playoff run.
Edge: Golden Knights - Holtby has been great, but it's impossible not to give the edge to Fleury and the Golden Knights here.
(Photos courtesy: Action Images)


