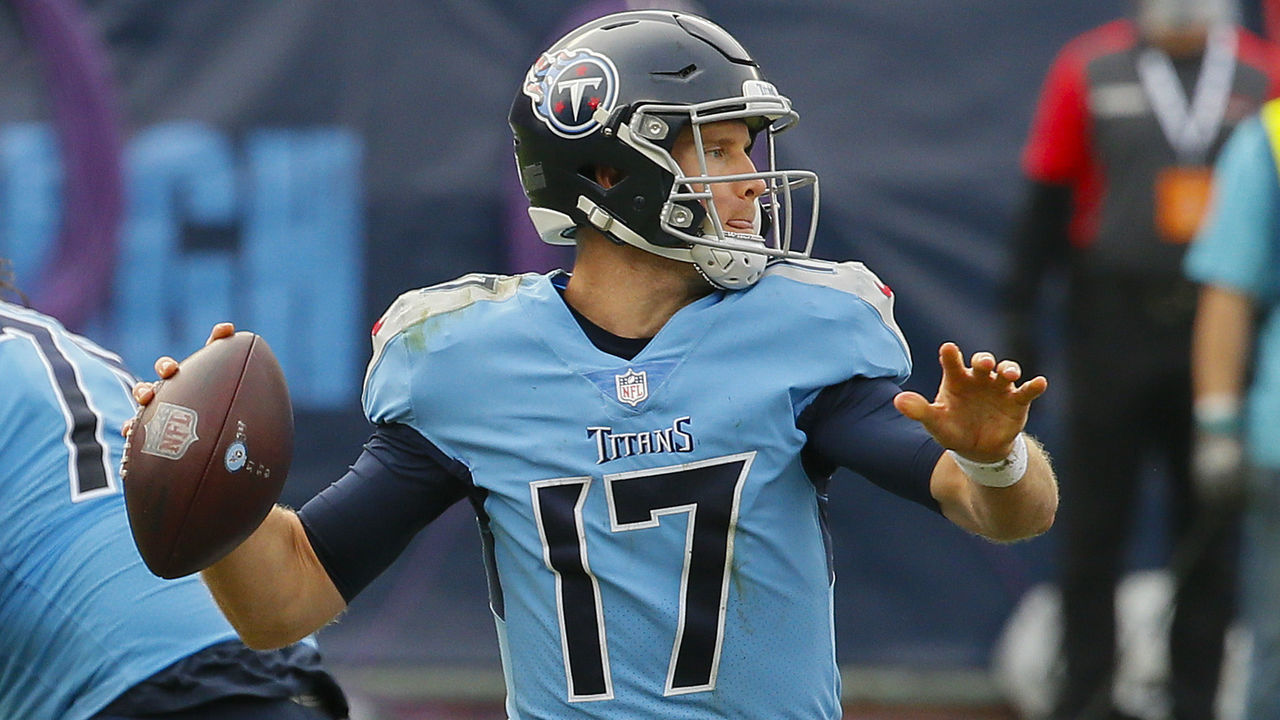
During the last two seasons, one particular NFL quarterback completed 62.9% of his passes, threw for 37 touchdowns against just 11 interceptions, and posted a passer rating of 93.1. Seems pretty good, right?
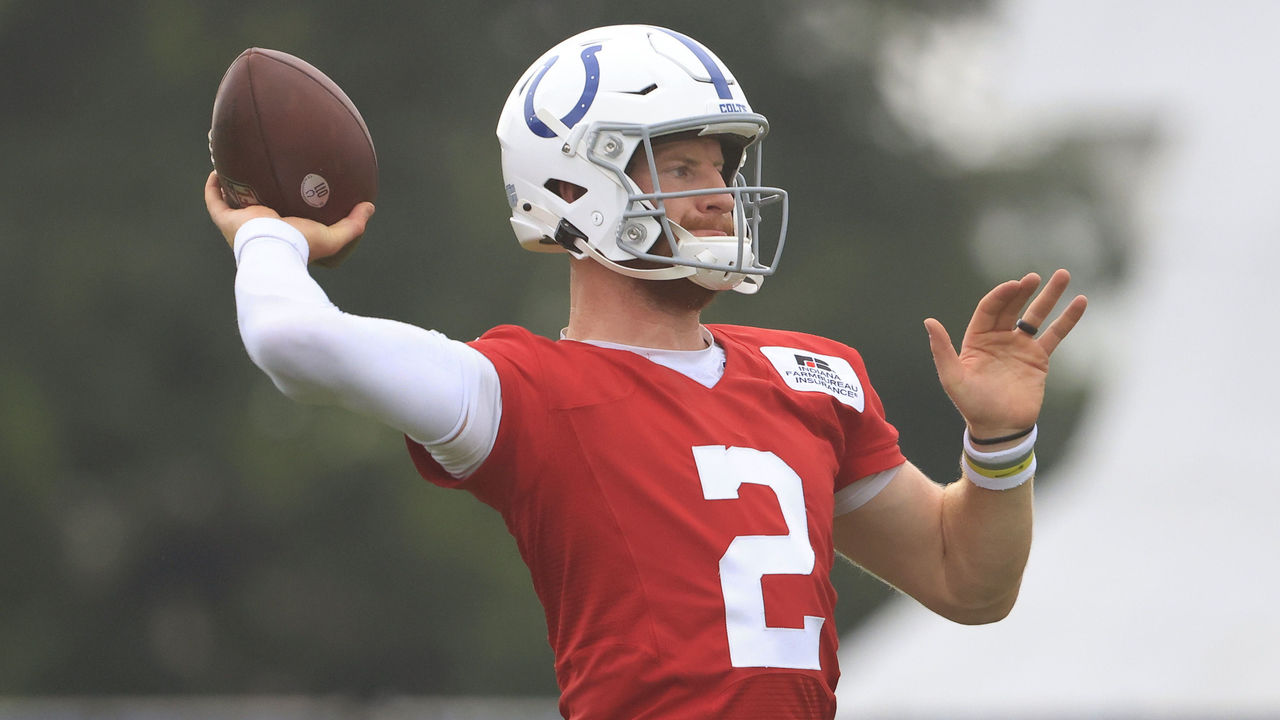
No one would mistake Gardner Minshew for a star, however, which is why the Philadelphia Eagles last week had to part with only a sixth-round pick to acquire him to be their third-stringer.
The dichotomy between Minshew's numbers and his actual performance is a perfect example of the inadequacy of most conventional football statistics, especially those frequently shown during television broadcasts and highlights packages. But better metrics - those that factor in situational differences - do exist.
Expected points (EP) and expected points added (EPA) are measurements that have been around for a long time, though they've become increasingly mainstream in recent years. Yes, it's helped that the hidebound NFL has finally embraced analytics and data-driven decision-making. But fans and media also now have access to a wealth of information that hadn't been publicly available. Additionally, a handful of mathematicians made something of a mission out of leveraging social media and the internet to share as much of that data as possible, thereby making it more accessible and easy to understand. The nerds have indeed won.
"EPA is not a magic bullet for solving football or anything," said Ben Baldwin, an economist and a contributor for The Athletic who serves as a kind of chief evangelist for EPA on Twitter. "But I think it's useful for understanding big-picture questions like which teams have been the most efficient on offense and defense."
What EPA can do is provide better context. After all, a four-yard completion on third-and-3 is much better than a seven-yard completion on third-and-8. Yet most conventional football statistics, which emphasize volume, make no distinction between the two.
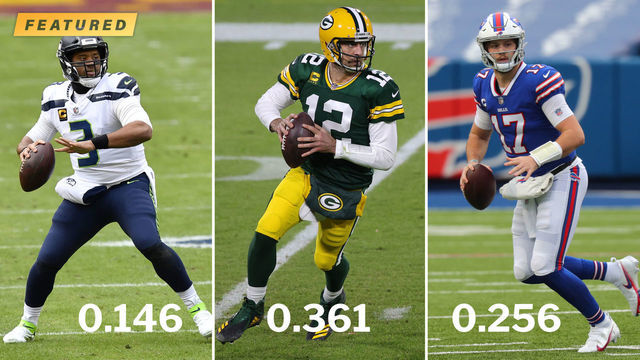
Let's go back to Minshew for a moment. Despite his seemingly good numbers, he quarterbacked a Jacksonville Jaguars team that was frequently playing from behind the last two years. As a result, his EPA per play of 0.048, which ranked just 28th in the league in 2019-20, better reflects how he actually performed. Keep that in mind whenever you see the same old stats for any QB.
EP, which refers to expected points, gets closer to quantifying situational nuances. It uses play-by-play data to create a scoring probability for the next play based on field position, down, distance, and time remaining, among other factors. First-and-goal at the opponent's 1-yard line, for example, has an expected value of six points, according to just about every EP model. EP provides a baseline for various down-and-distance scenarios, with EPA measuring how players or teams performed relative to that baseline.
The concept was first introduced back in 1971 by Virgil Carter, a graduate student who also happened to be an NFL quarterback. Carter, who played for the Chicago Bears in 1968-69, and his professor at Northwestern University, Robert Machol, published their findings based on the play-by-play data from the first half of the 1969 season in a research paper titled "Operations Research on Football," which analyzed expected points based on situations involving first down and 10 yards to go.
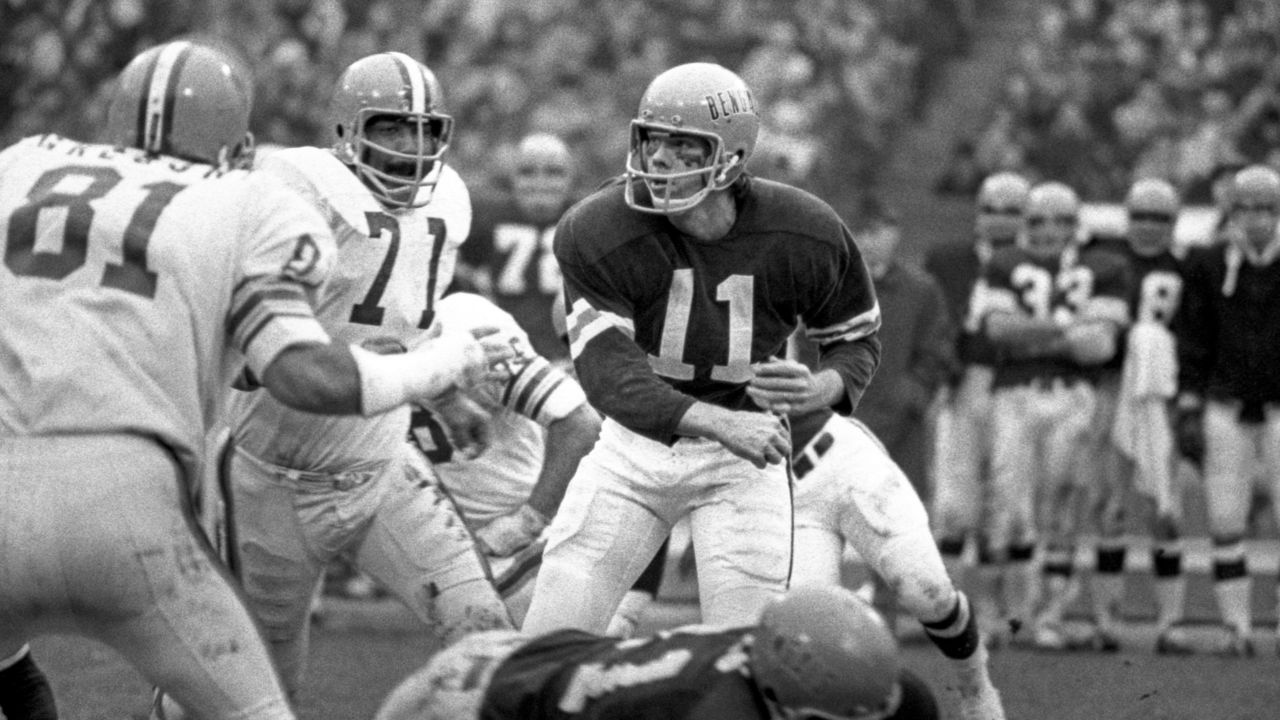
"Let's say I got the opening kickoff and I start at the 20-yard line," Carter told theScore. "That would lead to so many outcomes, and each one's an unknown percentage-wise, or value, but you can chart how many were fumbles, how many were interceptions, how many turned it over, head back 10 yards, up 10 yards, 20 yards, and how many of them kicked field goals and scored touchdowns. If you drew a line of all those options at each spot on the field then you can produce that expected value matrix.
"It's one of those black-box formulas that's always been there. I just stuck in the numbers and it jumps out at you."
Expected points didn't gain much traction at the time, but it resurfaced in 1988 when Bob Carroll, Pete Palmer, and John Thorn published "The Hidden Game of Football," a book that also advanced the concept of expected points added. EPA was simply the difference in expected points from one play to the next, or how a player or team performed according to the baseline expectation provided by EP.
By the early 2000s, Football Outsiders' Aaron Schatz developed a metric called defense-adjusted value over average - commonly known as DVOA - to determine team efficiency on offense, defense, and special teams. DVOA uses a down-distance-field position model that's similar to EPA, while also factoring in strength of opponent. DVOA, too, has proven to be more reliable than standard volume stats, but its formula isn't known to the general public.
In the late 2000s, a U.S. government contractor named Brian Burke created a website called Advanced Football Analytics. Armed with better computing power and access to play-by-play data (Carter's and Machol's research on expected points was limited to the primitive use of punch cards, which couldn't hold much data), Burke was able to build an EPA model that also incorporated second, third, and fourth downs.
"That was my contribution, to finally build a complete, full model for all downs - not just first down," Burke told theScore. "They were making some assumptions about second and third down in some of the previous work, but they were drawing a line between six points at the goal line and minus-two points at the team's own goal line. I was like, 'I think I want to do something that actually fits the data.' That's what I did."
Burke's analytics work caught the attention of The New York Times and The Washington Post, who brought him on as a contributor. By 2011, when ESPN developed its Total QBR measurement for quarterbacks, EPA was integral to the recipe. A few years later, ESPN hired Burke full-time.
Burke did make one other important contribution back at his old site: He shared the raw play-by-play data, along with the full EPA model, including a calculator. (Regrettably, this has been lost to posterity, but Burke's open-source approach didn't go unnoticed.)
In 2017, a trio of researchers at Carnegie Mellon University - Ronald Yurko, Samuel Ventura, and Maksim Horowitz - published a paper about their own EPA model and the methodology that went into it. Their work went a step further by attempting to predict the outcome of the next scoring event, along with building NFLscrapR, an add-on package of NFL-specific commands to the R programming language that made it easier for anyone to collect and analyze raw play-by-play data.
"I'd like to think we played a pretty big role in helping this become more mainstream," Yurko told theScore. "It's really a testament to how you can communicate over Twitter. Twitter's replaced the old Baseball Prospectus chat rooms or whatever they used to have for baseball stats talk. The football analytics community lives on Twitter, so everything's grown from that."
NFLscrapR's capabilities soon caught the attention of Baldwin and other analytic-minded football writers like Kevin Cole of Pro Football Focus and Josh Hermsmeyer of FiveThirtyEight, both of whom began applying and incorporating EPA data into their work. But after the NFL changed the way it made play-by-play info available, the package's commands stopped working. Baldwin and a colleague named Sebastian Carl stepped into the breach by developing their own EPA model and data package, called NFLfastR, in addition to a website called rbsdm.com, which offers user-friendly dashboards to examine EPA in a more granular way without having to learn to write code.
"My feeling was, it's kind of lame to say people should use EPA but not provide a way for people to get EPA easily," Baldwin told theScore. "Now, all you have to do is open a website, put in a time period, and it will show you numbers or a graph or whatever you want to get. The idea is that there's not an excuse that it's hard to get your hands on anymore if it's just sitting on this website for anybody to use."
EP and EPA aren't perfect metrics. They can be complicated by end-of-half and end-of-game scenarios, which are influenced by the unpredictability of timeouts. Additionally, EP and EPA are predicated on scoring points, and teams playing with a lead in late-game situations or possessing the ball at the end of the first half will sometimes prioritize running out the clock over widening the margin of victory. Baldwin and Carl's website allows users to make up for this with a filter for garbage time and win probability - another metric that happens to be influenced by EPA.
Some EPA models also make era adjustments. Today's game - owing to schematic innovations and rule changes to protect QBs and pass-catchers, in addition to the way the sport is officiated - is far more dominated by passing than it used to be.
EPA is reliable enough that teams are using it to "understand the magnitude of plays" and to make decisions, as former Philadelphia Eagles analyst and game management coach Ryan Paganetti told Liam Fox of Forbes. The advent of player tracking data - a relatively new frontier that's only beginning to be explored and applied - has helped, too.
Yurko thinks it was "only a matter of time" before someone developed an open-source user tool for EPA, given how much groundbreaking work had been done by Burke and Football Outsiders.
"It was really very niche in 2008-09," Burke said. "I'm pretty shocked at how much the analytics side of football has really exploded."
Carter, the creator of EP, likened himself to one of the Wright brothers while comparing the current math crowd that's made so many strides with EPA to Neil Armstrong.
"I'm amused at it, I'd guess I'd say," Carter said. "It's certainly beyond what would ever think was possible from my little study."
Dom Cosentino is a senior features writer at theScore.