Countdown to Opening Day - 8: Offense continues to dwindle across game
In this 30-day series, theScore's MLB editors will preview the 2015 season with an in-depth look at some of the significant numbers - statistical milestones, jersey numbers and general miscellanea - poised to pop up throughout the campaign.
They don't hit 'em out like they used to.
Whether it's defensive shifts, drug testing, the strike zone, park factors, scouting, specialized relief pitching or hurlers bringing more heat with better control and command, there are more factors than ever to explain the power outage that's ripped through baseball.
Pitchers are striking more batters out, walking fewer and throwing harder - the average fastball velocity has increased a whopping two mph in the last 12 years.
Five of the six lowest scoring seasons over the last 20 years have occurred since 2010. The 2014 campaign marked the first time since 1995 that there weren't at least 20,000 runs scored in a season. And teams' 4.07 average runs scored per game was the lowest since the 1981 strike-shortened season. Needless to say, the offensive climate has changed drastically over the last few decades.
| YEAR | OPS | HR | K RATE | BB RATE |
|---|---|---|---|---|
| 1985 | .714 | 3602 | 14.0% | 8.6% |
| 1995 | .755 | 4081 | 16.2% | 9.1% |
| 1998 | .755 | 5063 | 16.9% | 8.7% |
| 2000 | .782 | 5692 | 16.5% | 9.6% |
| 2005 | .749 | 5017 | 16.4% | 8.2% |
| 2010 | .728 | 4613 | 18.5% | 8.5% |
| 2011 | .720 | 4552 | 18.6% | 8.1% |
| 2012 | .724 | 4934 | 19.8% | 8.0% |
| 2013 | .714 | 4661 | 19.9% | 7.9% |
| 2014 | .700 | 4186 | 20.4% | 7.6% |
To put the current offensive outage in perspective: The league average strikeout rate rose last season for the ninth consecutive year, with hitters getting punched out at a record clip.
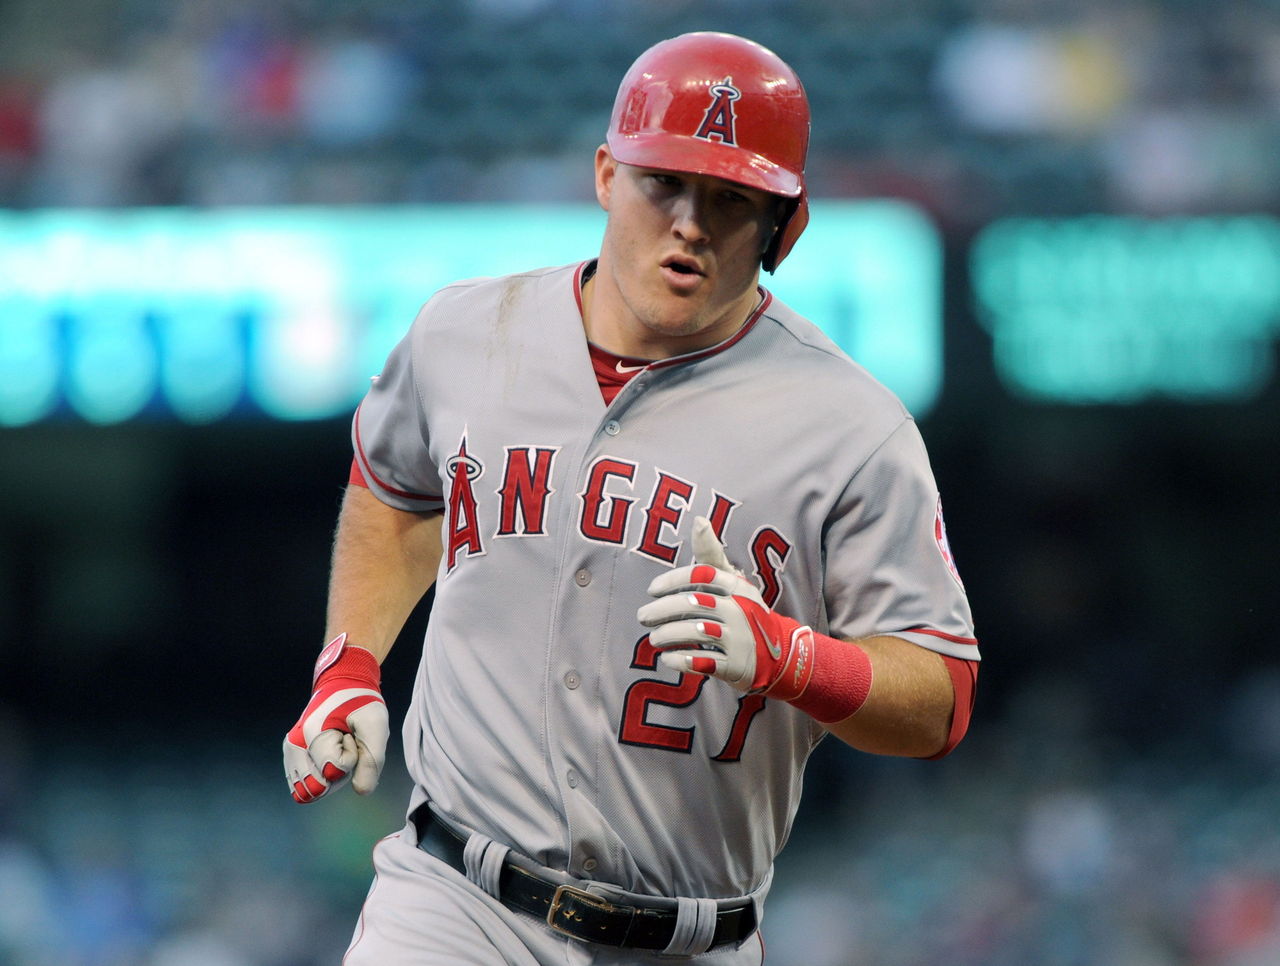
Meanwhile, last year's .314 league-average on-base percentage was the lowest rate since 1972, and just eight qualified hitters posted an OPS of .900-plus last season - a staggering 40 fewer than 2000. Mike Trout, Andrew McCutchen and Edwin Encarnacion are the only players to reach that figure in each of the last three seasons.
It isn't just rate stats on the decline, either. Major leaguers hit a record 5,692 home runs in 2000 - exceeding the 2014 total by more than 1,500. Sixteen players hit 40 or more homers in 2000, and 47 clubbed at least 30 bombs. Nelson Cruz was the lone hitter to reach 40 in 2014 (11 smacked 30-plus).
"I think 20 (homers) is the new benchmark - 30 is elite power," Toronto Blue Jays third baseman Josh Donaldson recently told The Associated Press.
Donaldson's teammate Jose Bautista (2010) and Chris Davis (2013) are the only two players to club 50 in the last five years. Four players, famously highlighted by Mark McGwire and Sammy Sosa, achieved the milestone in 1998.
We're in the midst of a significant downward trend in power and offense is being sucked out of the game at levels not seen in decades. As we embark on a new season, players like Giancarlo Stanton and Kris Bryant have never held more value.