How batted ball stats can help you predict the future in fantasy baseball
Follow theScore's fantasy feed on Twitter (@theScoreFantasy) for the latest news, features and more.
Baseball is a weird game. It requires both physical and mental toughness, skill, athleticism and intelligence - but also an abundance of luck. In the words of the late Yogi Berra, "I'd rather be lucky than good."
The box score can say a player went 4-for-4, but it won't tell you if he had a broken bat single, an infield hit, and two bloop singles. The box score also won't tell you that a player who went 0-for-4 finished with two line outs to center and two warning track fly outs.
The most important thing to remember about baseball, and specifically fantasy baseball, is that the MLB season is really long. More often than not, a player's numbers will even out over the course of a 162 game season. The following statistics (all courtesy FanGraphs) need to be used to predict trends and determine whether players have been lucky or unlucky.
BABIP
Definition: Batting average on balls in play. Home runs do not classify as balls in play, and are therefore excluded. League average is .300.
BABIP is helpful, but it never tells the whole story. Just because a player has a BABIP of .250 or .350 doesn't mean regression is always on the horizon.
Power hitters who lift the ball but lack foot speed, such as Chris Carter, will almost always have a BABIP well below .300. On the opposite end of the spectrum, fast players who hit a lot of line drives and ground balls, such as Jonathan Villar, will almost always have a BABIP well above .300.
BABIP can be used to predict regression, but only when viewed with the following stats:
LD% / GB% / FB% / IFFB%
Definition: The percentage of balls in play resulting in a line drive, a ground ball, a fly ball or an infield fly ball. League averages are roughly 21% / 44% / 35% / 10%.
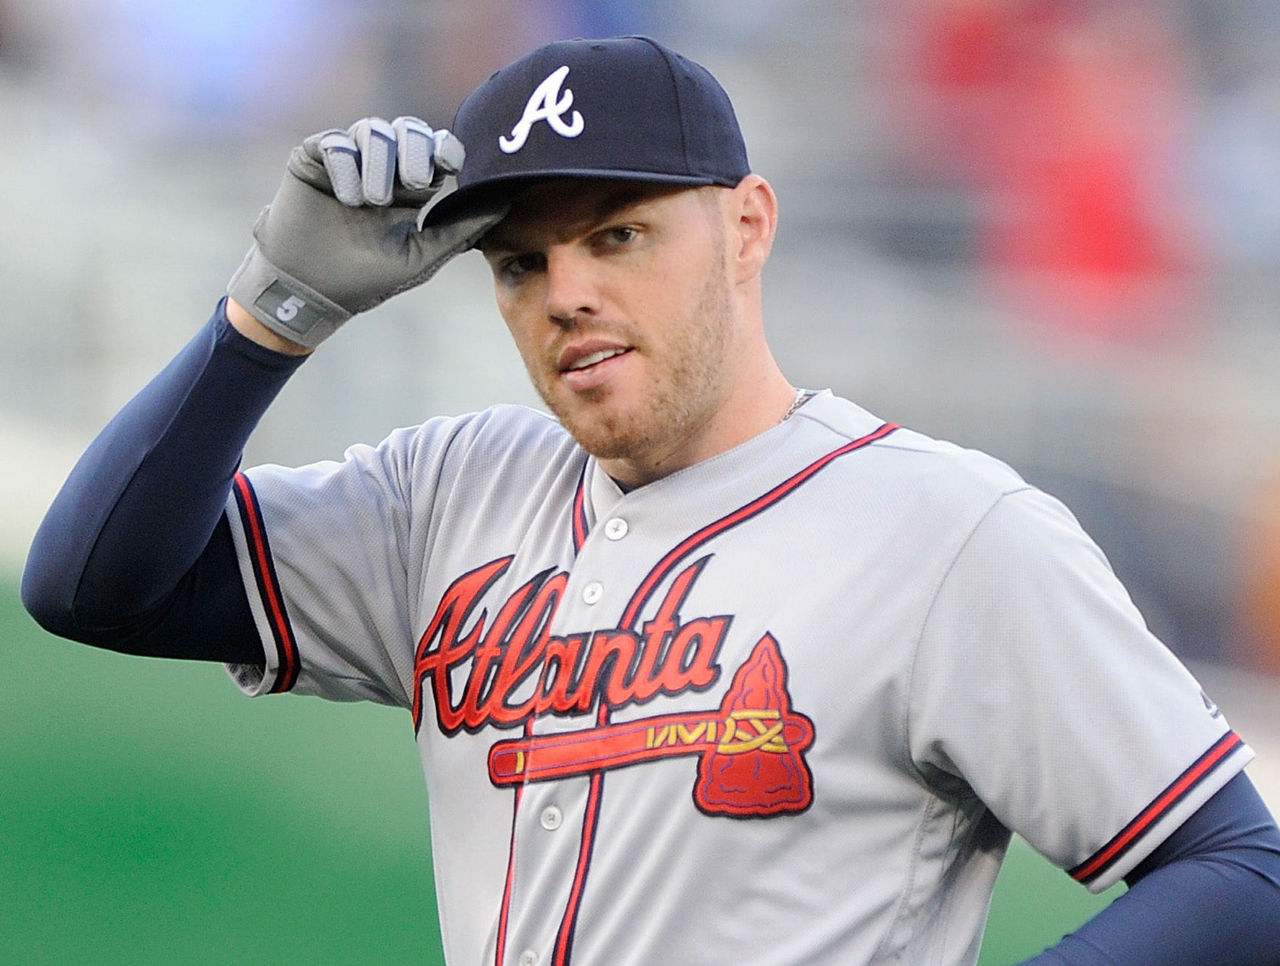
A player who hits a lot of line drives is going to be more consistent from season-to-season. Freddie Freeman led the majors with a 29.1 LD% in 2016. If you notice that a player has a high LD% but a low BABIP, that player is probably due for positive regression. Joe Mauer is a great example of this.
Even since concussions forced Mauer to move out from behind the plate and become a full-time 1B/DH, he has failed to be a fantasy relevant player. His 26.8 LD% was the fifth-best mark in the majors last season and a 2.7 percent increase from his career rate. He also improved his walk rate and cut down on his strikeouts, but only hit .261 with a .301 BABIP.
It wouldn't be shocking at all if Mauer bounced back in a big way and hit .300 in 2017.
If you notice a player is hitting more fly balls than in previous seasons, he is likely looking to sacrifice batting average in exchange for power. In some cases the batter may be getting pitched upstairs more often, but in others you can actually see that a hitter is dropping his back shoulder in his load to intentionally lift the ball.
In terms of pitching, target pitchers who induce ground balls and infield flies. Marcus Stroman led the majors with a 60.1 GB% in 2016 - the next best was Jaime Garcia at 56.7. Given the strength of Toronto's infield defense, combined with Stroman's 17th-highest BABIP, he is bound to improve upon his 2016 numbers. A bad mid-season stretch really inflated his stats.
Soft% / Med% / Hard%
Definiton: The percentage of balls in play that were classified as hit with soft, medium or hard speed. League averages are roughly 20% / 50% / 30%.
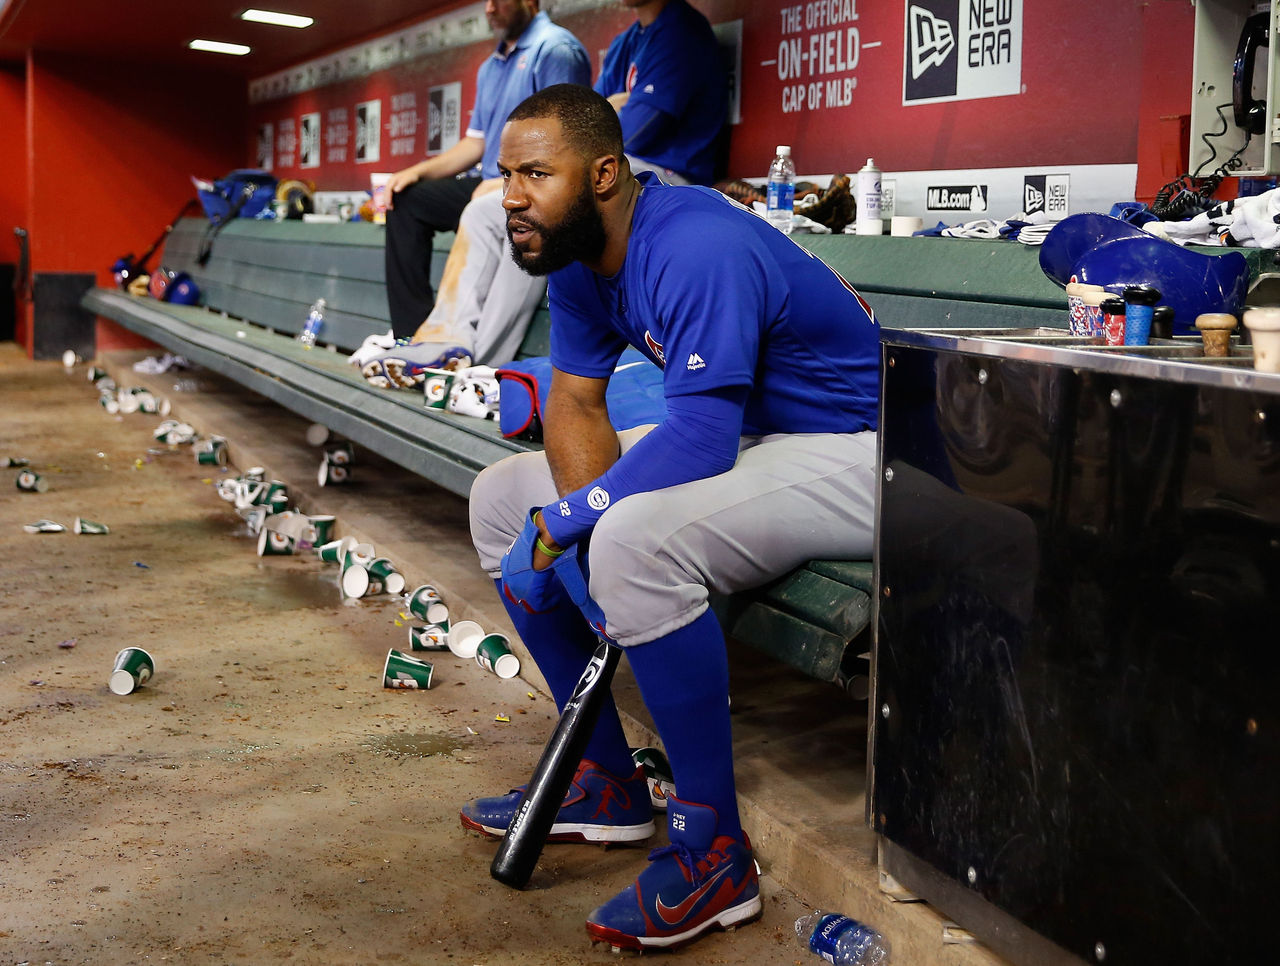
These stats can explain strange trends. Jason Heyward had the second-highest LD% of his career last season and his K% was 2.4 percent better than his career rate. Yet, he had his worst offensive season as a pro, posting a .631 OPS. The reasoning for this can be found in his batted ball speed.
Heyward had the worst Soft% in all of baseball last season at 27.1 percent. If you watched Heyward play much last year, he was often out in front and rolling over on balls, providing weak contact. This explains his .266 BABIP.
On the pitching side, Brandon Finnegan had a solid season in 2016, going 10-11 with a 3.98 ERA. Finnegan will be 24 this season, so logically you would think he will improve.
Finnegan had the fifth-highest Hard% and 12th-highest LD% against, yet his BABIP was just .256. He was extremely lucky to have an ERA below 4.00 considering how hard he was hit. If Finnegan fails to make adjustments in the offseason, his 2017 forecast is looking ugly.
How to apply these to fantasy decisions
The examples above indicate how you can predict trends using these batted ball percentages. It is very important to trust these stats, yet at the same time trust your own judgement.
If there are players on your fantasy team off to strong starts who have been "lucky" based on these stats, then that would be the time to sell high on them and obtain top value. Finnegan is an example of someone whose luck went an entire season without running dry, but more often than not, these numbers correct themselves over the course of 162 games (or 32 starts).
On the flip side, check out FanGraphs as often as you can and look at league leaders among various batted ball percentages. This can tell you which players are due to get some luck on their side.
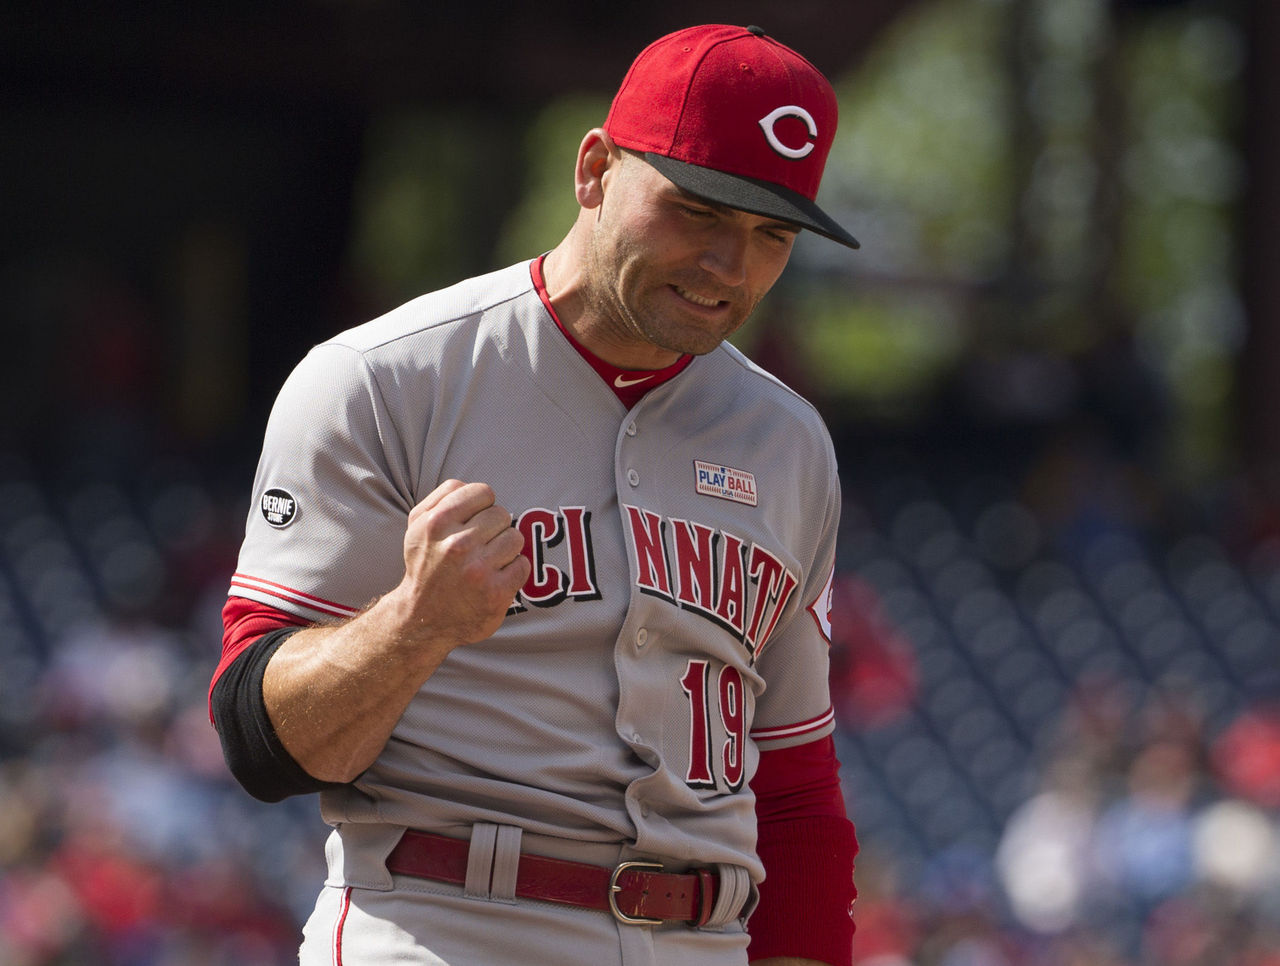
Even during the first two months of the season when Joey Votto was struggling, he was still hitting plenty of hard line drives. Anyone who recognized this and bought low on Votto surely reaped the benefits, as he hit .408 in the second half of the season. Be that fantasy player in 2017.
HEADLINES
- McCarthy: Reunion with Rodgers in Pittsburgh would be 'great story'
- MLB's top 25 players 25 and under for 2026: 10-1
- Warriors' Moody carted off with apparent knee injury in OT vs. Mavs
- Wemby argues case for MVP, aims to leave 'no debate' by end of season
- Dodgers' Sasaki struggles again in exhibition start against Angels