Ever wanted to take a detailed look at how much teams spend on a particular position in the NFL? Well now thanks to The Guardian, you can.
The Guardian put together an interactive chart that lets you look and see how each NFL team distributes available money across each position. For example, let's look at the matchup from Thursday night between Denver and Baltimore.
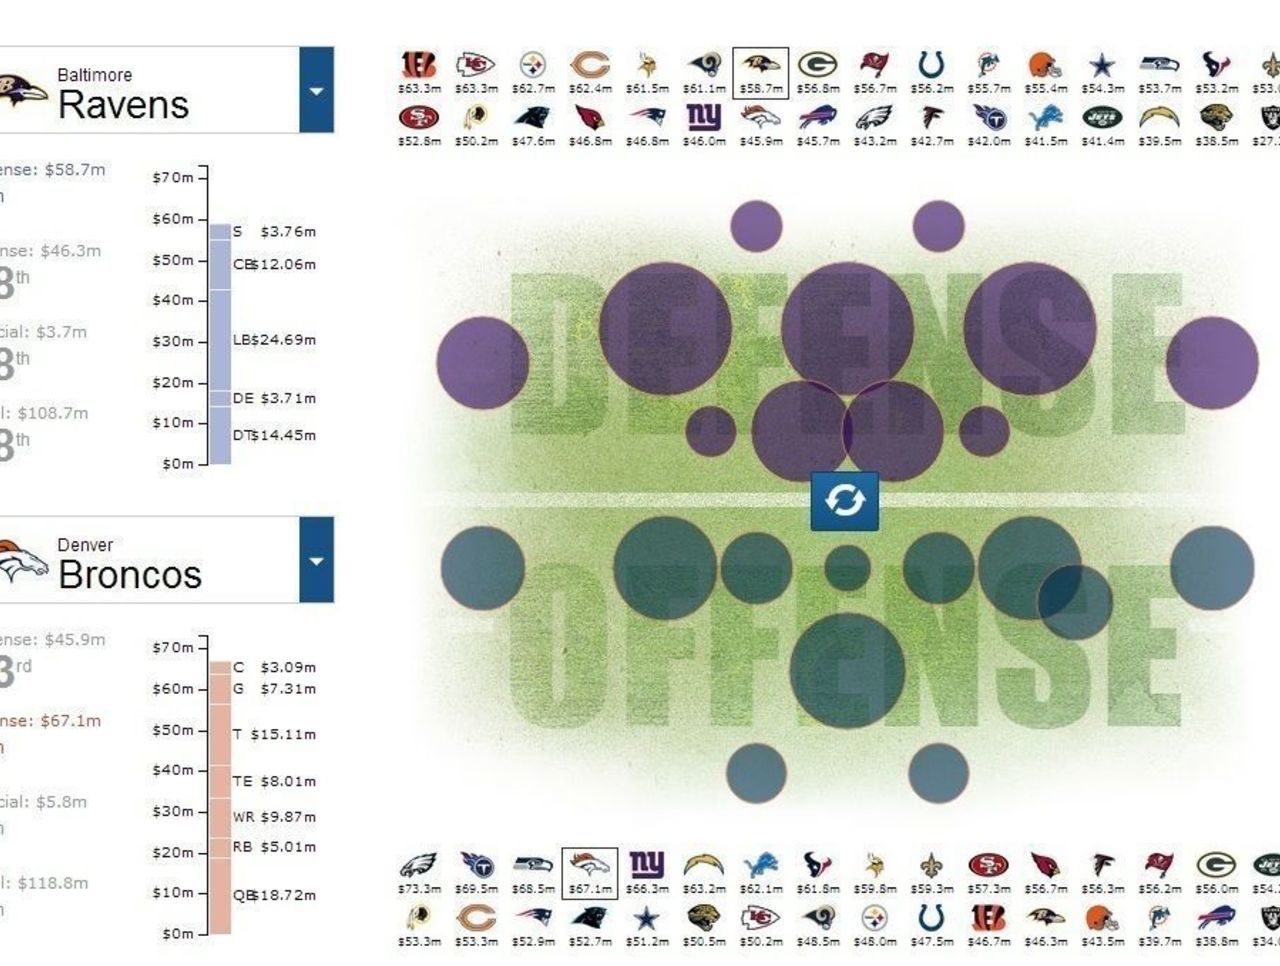
The size of each circle represents the cap hit at that particular position. The image above shows the Ravens defense and the Broncos offense, letting you see what they value most based on spending habits.
No surprise the largest circle for the Denver offense is at quarterback with Peyton Manning accounting for most of it with his $17.5 million cap hit. On the Baltimore side of things, the linebacking corps is clearly most expensive. Terrell Suggs' cap hit of over $13 million leads the way, but the Ravens invest heavily in the position with five different players earning at least $1 million.
The chart allows you to bring up the offense and defense of every team in the NFL and can be a very valuable tool when trying to decide what positions teams in the NFL find to be the most important.